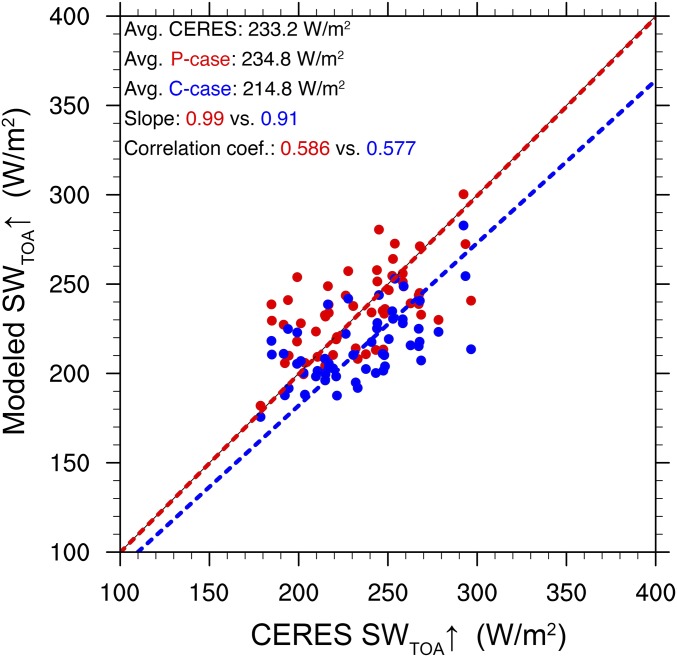
Fig. 3.
Scatterplot of modeled SWTOA↑ vs. CERES SWTOA↑ observations. Each point represents the value averaged over 0900, 1200, and 1500 UTC for each day of the study period. The regression slope is set to pass the (0, 0) point. According to a Student’s t test, the difference between P case and C case is significant at the 0.01% level.

