Fig. 4.
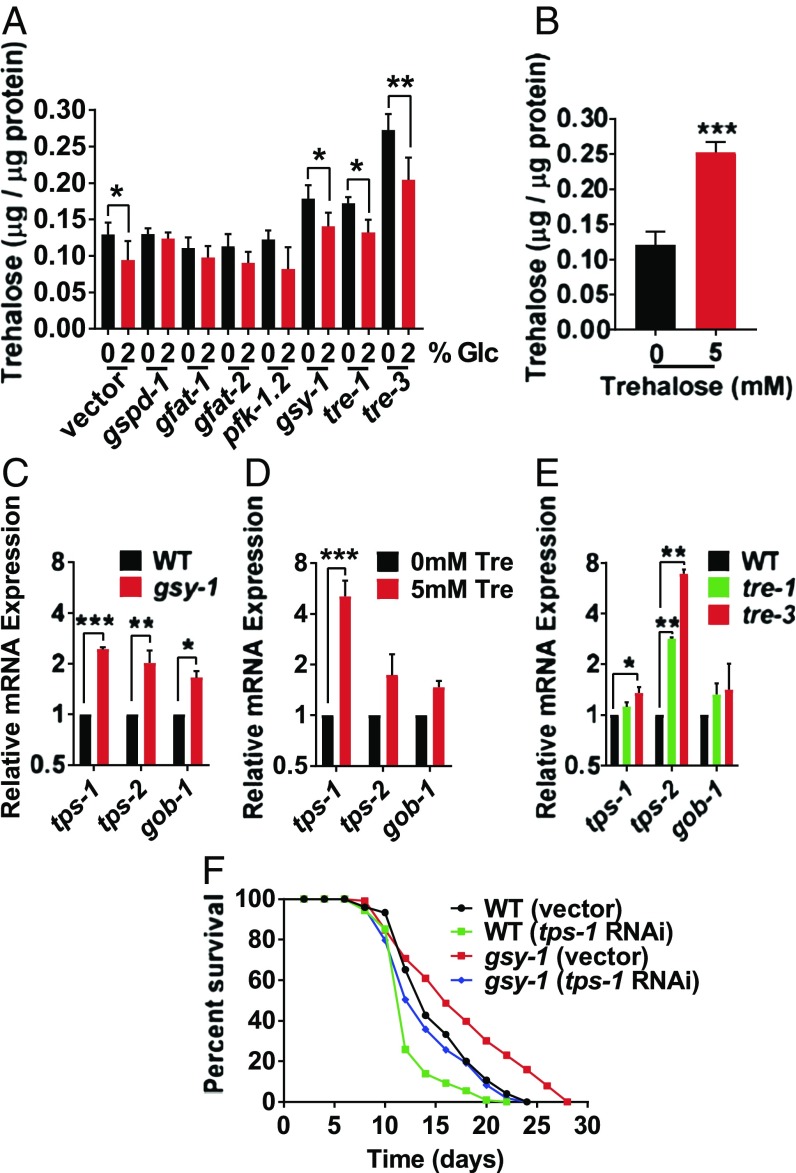
Animals with increased internal trehalose exhibit lifespan extension. (A) Internal trehalose levels of wild type on 0% or 2% glucose, with either empty vector, gspd-1, gfat-1, gfat-2, or pfk-1.2 RNAi; and gsy-1, tre-1, and tre-3 mutants on 0% or 2% glucose, UV-killed OP50 E. coli. (B) Internal trehalose levels of day 1 adults, on 0 mM or 5 mM trehalose, UV-killed OP50 E. coli, internal trehalose levels standardized to protein content. (C) RT-qPCR of trehalose synthesis genes in wild-type day 1 adults and gsy-1 mutants day 1 adults, OP50 E. coli. (D) RT-qPCR of trehalose synthesis genes in wild-type day 1 adults on 0 mM or 5 mM trehalose, UV-killed OP50 E. coli. (E) RT-qPCR of trehalose synthesis genes in wild-type, tre-1, and tre-3 mutants day 1 adults, OP50 E. coli. (F) Lifespan of wild type and gsy-1 mutants, 200 µM FUdR, with either empty vector or tps-1 RNAi (*P ≤ 0.05, **P ≤ 0.01, ***P ≤ 0.001).

