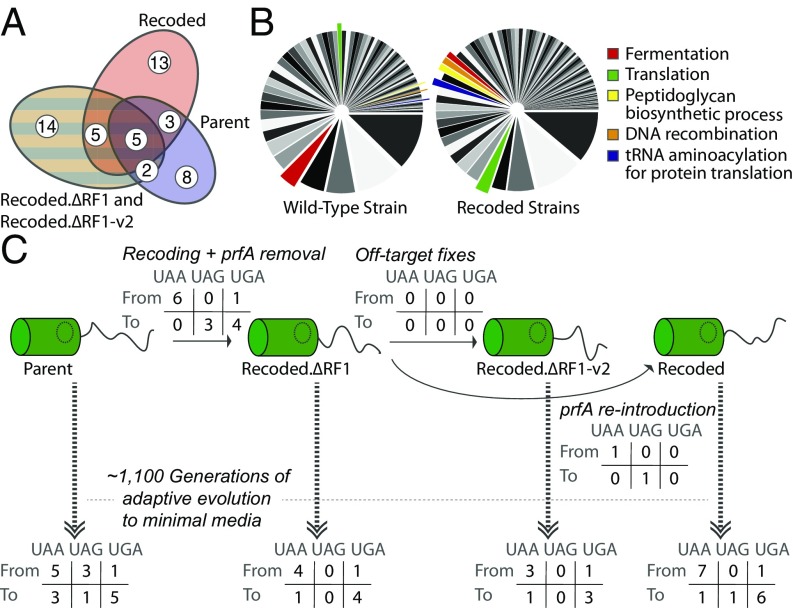
Fig. 2.
Next-generation sequencing results and variants of interest from independent evolved populations. (A) Venn diagram showing distribution and quantity of multiply hit genes from each individual strain. (B) Gene ontology results showing all categories of mutations found in nonrecoded Parent (Left) or in recoded strains (Right). Sector size corresponds to the number of mutations observed to genes with a particular GO term. Highlighted in red are GO terms of interest. (C) Results from analysis of changes in stop codon usage in evolved lineages.

