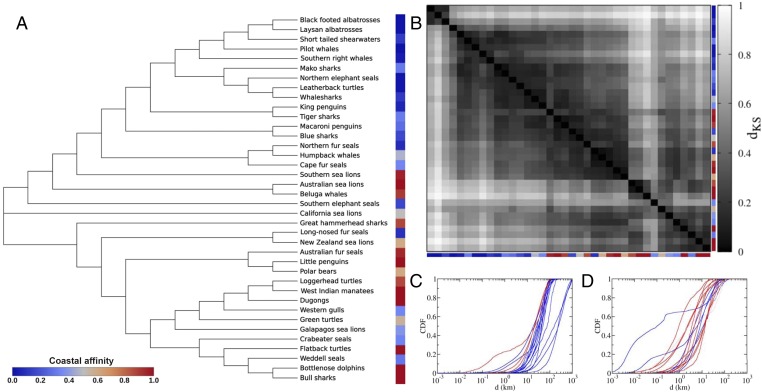
Fig. 4.
Analysis of distances between the CDFs of displacements for each pair of species. The colors shown correspond to the classification of each species as having high (red) or low coastal affinity (blue) based on the proportion of their observed displacements occurring completely within coastal ocean for each individual of the same species (SI Appendix, Table S4). (A) Dendrogram obtained from the distance matrix derived from the Kolmogorov–Smirnov analysis showing two main branches (anchored by the line for California sea lions) broadly associated with low (<0.5; upper branch) and high (>0.5, lower branch) coastal affinity. (B) Distance matrix (mirror image from diagonal) with darker colors indicating short distances (dKS) between the species’ CDFs. C and D show the CDF of displacements for species in the upper and lower branch of the dendrogram, respectively, highlighting distinct displacement regions (d in the x axis) for the curves relative to species occurring mostly on open and coastal oceans, respectively.

