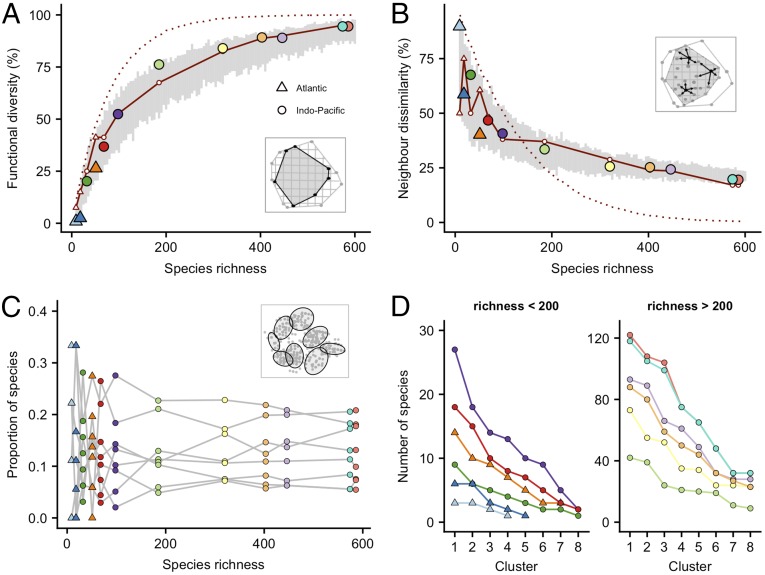
Fig. 2.
Relationship between species richness and functional diversity (A), species dissimilarity (B), imbalances in trait space (C), and redundancy in trait space (D) across major biogeographical provinces. In A and B, colored points represent 12 provinces with the corresponding color code from Fig. 1. Functional diversity is measured as the percentage of occupancy of the global trait space hypervolume in each province. Species dissimilarity is measured as the average distance between species and their closest neighbors in trait space (a visual representation of each metric is shown in gray boxes). Gray bars show a null model of random species allocation for each species richness value, indicating the mean and 95% confidence intervals of 100 iterations. Solid red lines indicate an alternative analysis of 80 fine-scale clusters of species (or functional entities), indicating the proportion of clusters occupied by species (A) and the proportion of occupied clusters that contain only one species (B). Dotted red lines indicate the same metrics under a null model of random assignment of species to clusters. In C and D, colored points represent eight coarse-scale clusters of species in trait space, colored by province (the positioning of clusters in trait space is shown in the gray box). Imbalances in trait space are indicated by the proportional representation of each major cluster in the species pool of each province, with gray lines linking the same clusters across provinces. Redundancy in trait space is indicated by the number of species occupying major clusters in each provincial trait space (colored lines), plotted in rank-descending order along the x axis from high to low redundancy.

