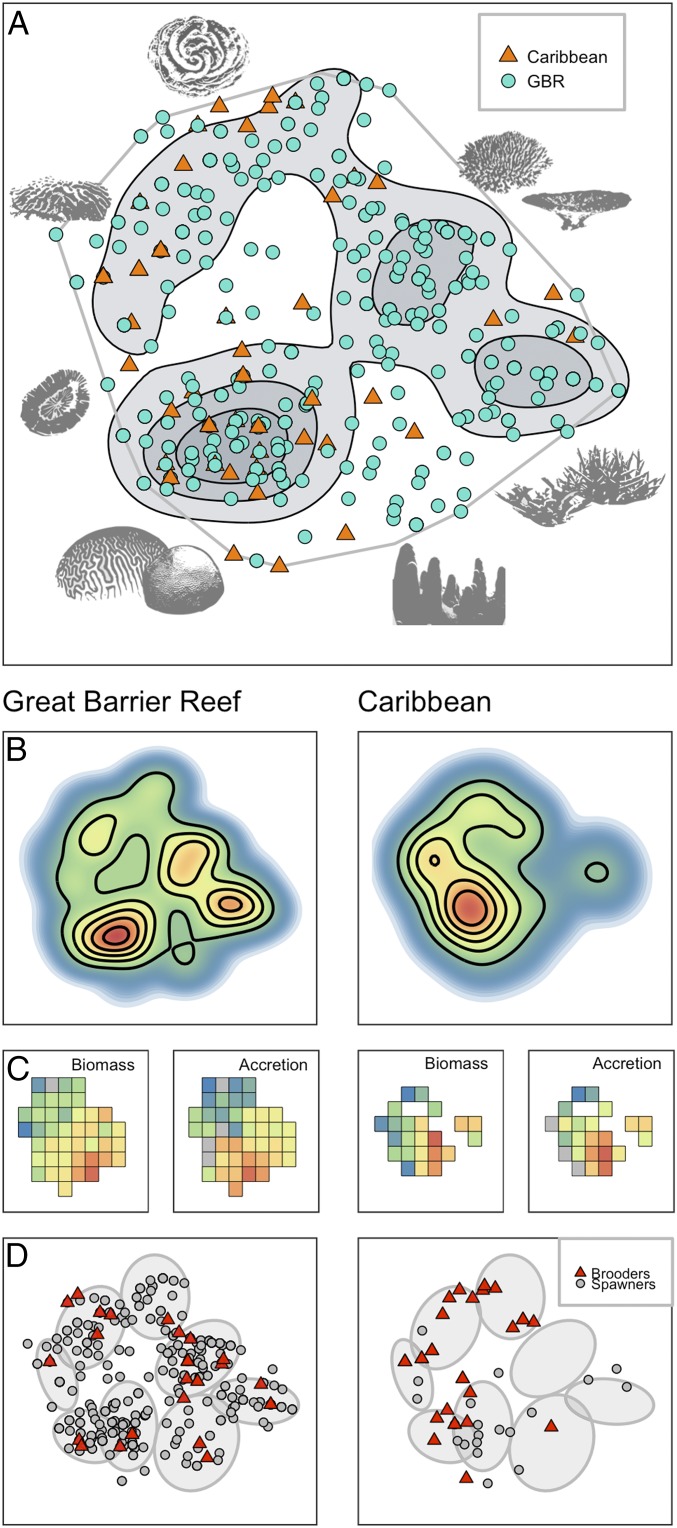
Fig. 3.
Diversity and redundancy of trait space on the Great Barrier Reef and in the Caribbean. (A) Coral trait space, with species (points) colored blue for the Great Barrier Reef and orange for the Caribbean, showing the overlap in trait space between the two domains, and contours of high species density shown in gray. (B) Heat map of species density in the global trait space for each domain, with contours indicating peaks of richness and similarity. (C) Heat map for each domain of two functional traits, the total tissue biomass and skeletal accretion rates of colonies. The squares represent the portion of 80 fine-scale species clusters or functional entities that are occupied in each province (gray indicates deficient data). (D) Distribution of reproductive modes in trait space in both domains. The ellipses illustrate eight coarse-scale species clusters.

