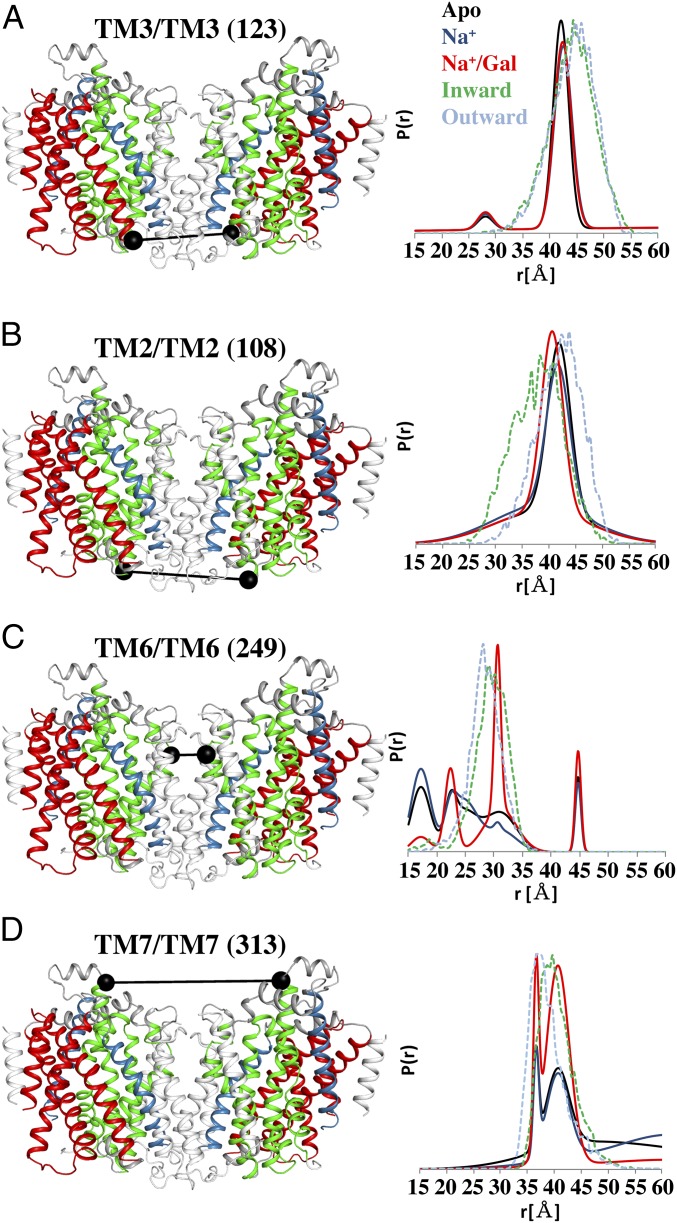
Fig. 2.
DEER of single-cysteine constructs confirms a dimeric arrangement of vSGLT. Cartoon representations of the crystallographic vSGLT dimer are shown with the same color code as in Fig. 1, with an addition of the nonconserved helices in gray. Labeling sites used for DEER spectroscopy are marked with black spheres connected with black lines. A and B report the crystallographic location and corresponding distance distributions of sites on the intracellular side, whereas C and D show extracellular sites. Distance distributions represented as the probability of a distance [P(r)] versus distance (r) is shown for each pair. Data were obtained for the Apo (black), Na+-bound (blue), and Na+- and galactose-bound (red) intermediates. MDDS-derived distance distributions for the inward-facing structure (green dash) and the outward-facing model (cyan dash) correlate with the primary peaks in the DEER data.

