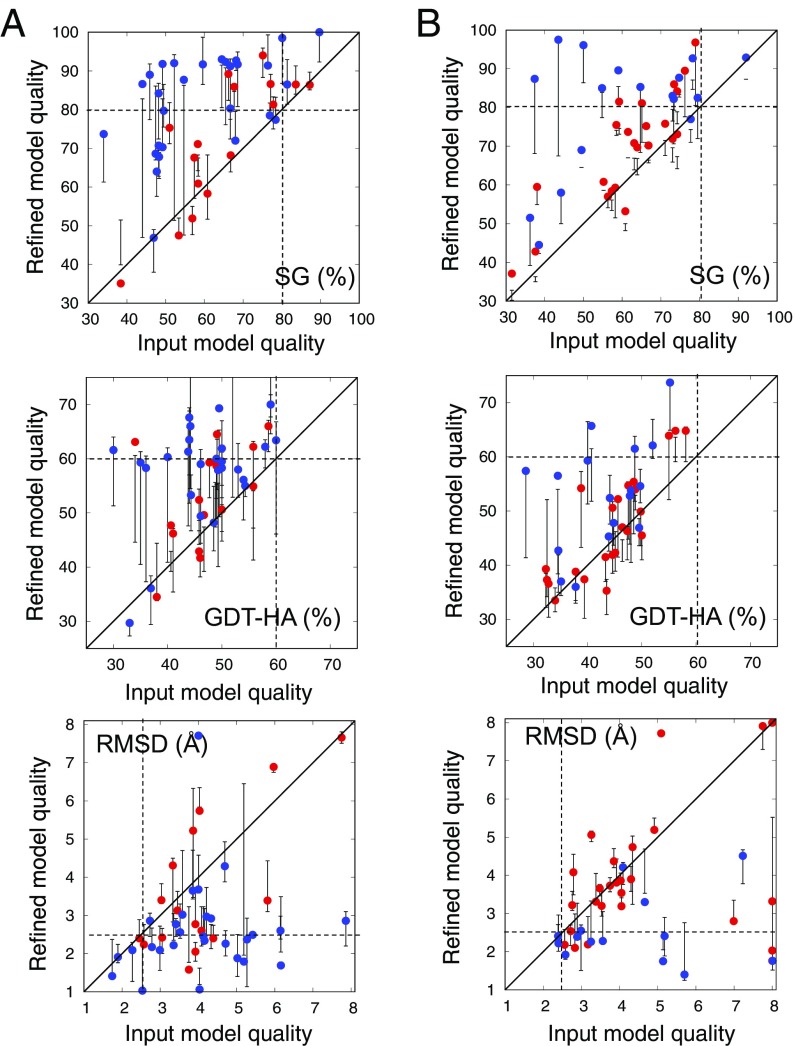
Fig. 1.
Performance of refinement protocol on benchmark set. (A) Benchmark set1—44 proteins from CASP and CAMEO rounds up to September 2015. The starting homology models were generated by multiple different servers. (B) Benchmark set2—40 proteins from CAMEO rounds since October 2015. The starting homology models were generated by the Robetta server (19, 20). In each panel, model quality is compared between input models (x axis) and refined models (y axis) using three different model accuracy metrics. (Top) SphereGrinder (SG); (Middle) GDT-HA; (Bottom) rmsd (SI Appendix). For SG and GDT-HA, higher values are better, and the native structure has a value of 100. Models with values better than the thresholds indicated by the dashed lines (SG > 80, rmsd < 2.5 Å, and GDT-HA > 60) for two of the three metrics are considered “correct folds.” Points represent the single refined model; the error bars represent the range of model qualities of the five cluster representatives. Blue, proteins with less than 120 residues; red, proteins with 120 or more residues. The refinement protocol consistently improves input models in both benchmarks.

