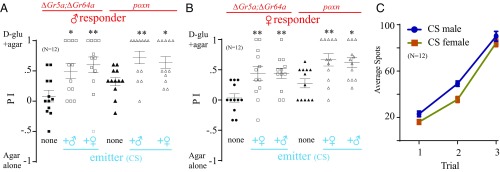
Fig. 6.
Signal is not sex-biased. (A) Preference of 20 starved male ∆Gr5a;∆Gr64a or poxnΔM22-B5 (poxn) responders when mixed with 10 starved WT emitters, either male or female, in the two-choice assay. Asterisks indicate significant differences from the control group, where no WT flies were mixed (one-way ANOVA, followed by a Bonferroni test; n = 12). (B) Preference of 20 starved female ∆Gr5a;∆Gr64a or poxn responders when mixed with 10 starved WT emitters, either female or male, in the two-choice assay. Asterisks indicate significant differences from the control group, where no WT flies were mixed (one-way ANOVA, followed by a Bonferroni test; n = 12). (C) Average number of spots produced by 30 starved WT male or female flies in the two-choice arena. Trial 2 and trial 3 refer to second and third additional 2-h exposures to new sets of 30 starved WT flies (n = 12). *P < 0.05; **P < 0.01. Error bars indicate SEM. d-glu, d-glucose.

