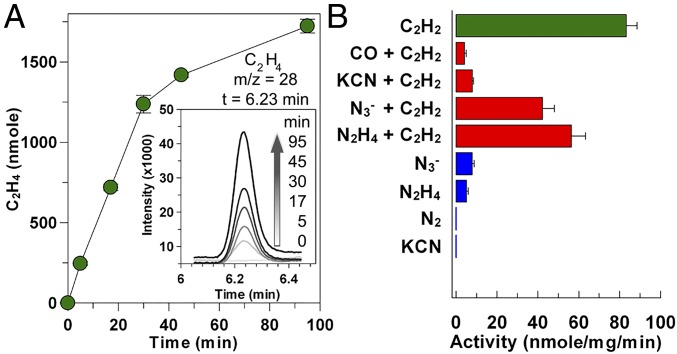
Fig. 3.
Reductive activities of DCCPCh. (A) Progress curve for reduction of acetylene (C2H2) to ethylene (C2H4). Time-dependent intensity profile derived from the mass spectra for ethylene. Area of intensity at each time was converted into amount of ethylene by a standard curve. (B) Reduction of acetylene (green bar) and its inhibition (red bars) were determined by quantifying ethylene production. The potential reduction of nitrogenous compounds (blue bars) was detected by NH3 production.

