Fig. 5.
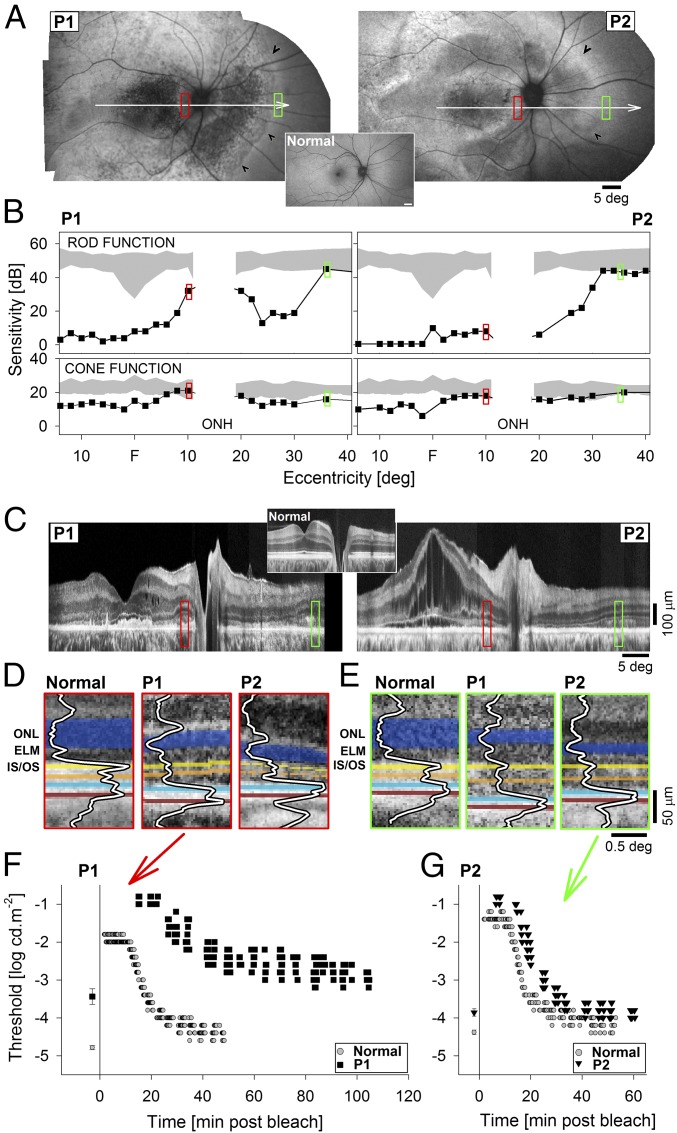
Retinotopic phenotype in patients with ARB. (A) RPE health across the retinas of two ARB patients, P1 and P2, imaged with short-wavelength reduced-illuminance autofluorescence imaging (SW-RAFI), taking advantage of the natural RPE fluorophore lipofuscin. White arrows depict the location of the perimetric profiles and OCT scans; red and green rectangles show the regions of interest shown in other panels; and black arrowheads demarcate disease-to-health transition in the nasal midperipheral retina. (A, Inset) Normal SW-RAFI for reference. (B) Perimetric light sensitivity of rods in dark-adapted (Upper) and cones in light-adapted (Lower) eyes measured across the horizontal meridian. Gray regions represent normal sensitivity except for the physiological blindspot corresponding to the optic nerve (ONH). (C) Retinal cross-section with OCT along the horizontal meridian crossing the fovea. (C, Inset) Normal OCT for reference. (D and E) Detail of outer retinal lamination in patients compared with normal at the two regions of interest at the parapapillary retina (D, red) and midperipheral nasal retina (E, green). Layers and peaks are highlighted for visibility. Orange indicates interface near COS tips, blue indicates interface near ROS tips and RPE apical processes, brick indicates interface near the RPE and Bruch’s membrane. (F and G) Dark-adaptation kinetics measured in P1 at the parapapillary locus (F) and in P2 at the nasal midperipheral locus (G). Time 0 refers to the end of adaptation light. Baseline thresholds obtained after extended dark adaptation are shown before time 0.

