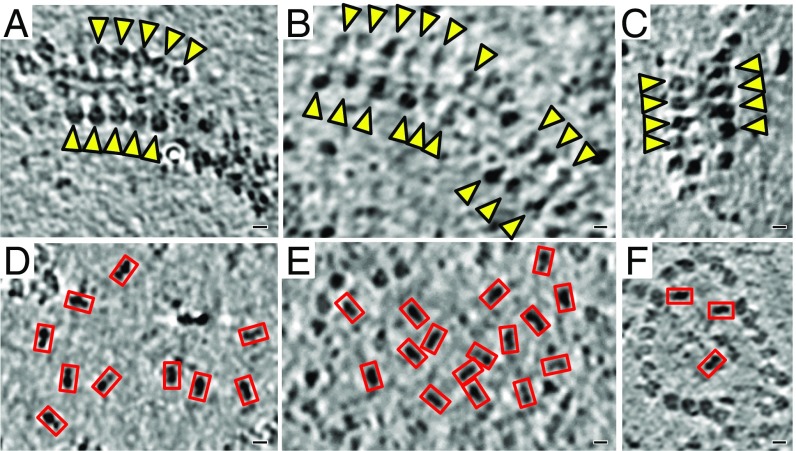
Fig. 1.
Distribution of complex I and ATP synthase. Tomographic slices of mitochondrial membranes from bovine heart (A and D), Y. lipolytica (B and E), and A. officinalis (C and F) indicating the organization and orientation of ATP synthase (A–C, yellow arrowheads) and the complex I matrix arm (D–F, red rectangles). The random distribution and orientation of complex I in the membrane indicates that there are no respiratory strings (58). (Scale bar: 5 nm.)

