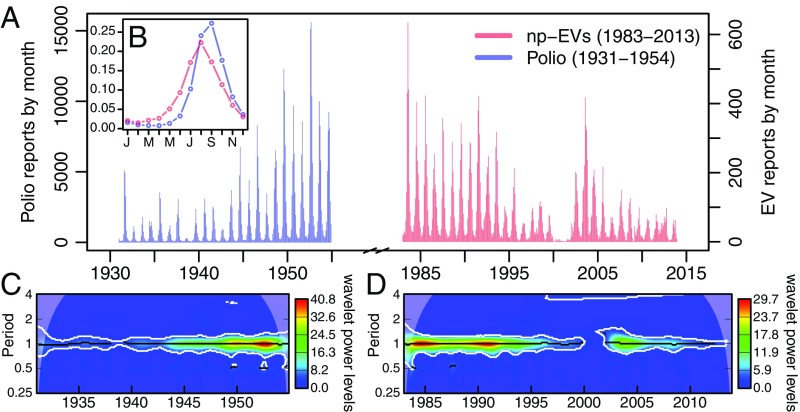
Fig. 1.
Annual summer seasonality of nonpolio enterovirus and historical poliomyelitis cases in the United States. (A) Time series of the monthly number of nonpolio enterovirus cases (np-EVs; red) and poliomyelitis cases (Polio; blue) in the United States during the periods 1983–2013 and 1931–1954, respectively. (B, shown as Inset) Average monthly distribution of cases within the year for nonpolio enterovirus (red) and poliomyelitis (blue) based on all cases reported. (C and D) Average wavelet power of the two time series in A: poliomyelitis (C) and nonpolio enteroviruses (D).

