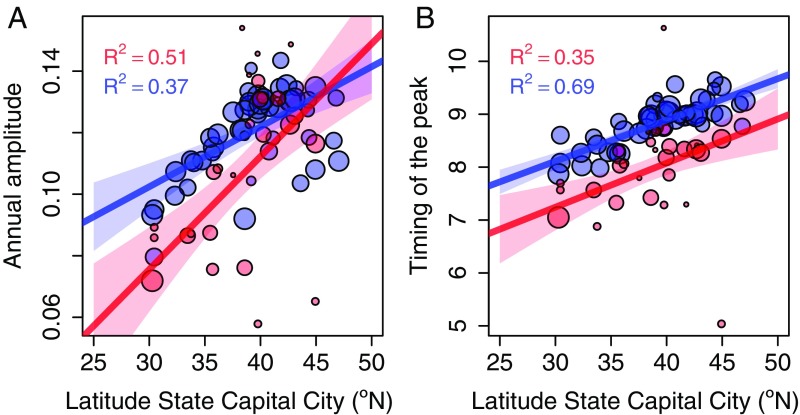
Fig. 3.
Latitudinal gradients in the seasonal pattern of nonpolio enterovirus (red) and poliomyelitis (blue) cases. (A) Gradients for the annual amplitude. (B) Gradients for the timing of the peak. The dots are mean values per state of the seasonal characteristics (amplitude and timing of the peak) weighted by the number of cases informing that value each year. The size of the dots indicates the number of years informing the mean value of each state. The lines are the estimated linear regressions weighted by the number of years informing each value, and the shades are the 95% CIs of the estimated linear regression by minimizing the least squares. A sensitivity analysis of A and B data using the latitude of the state’s center of population showed a similar pattern (SI Appendix, Fig. S4).

