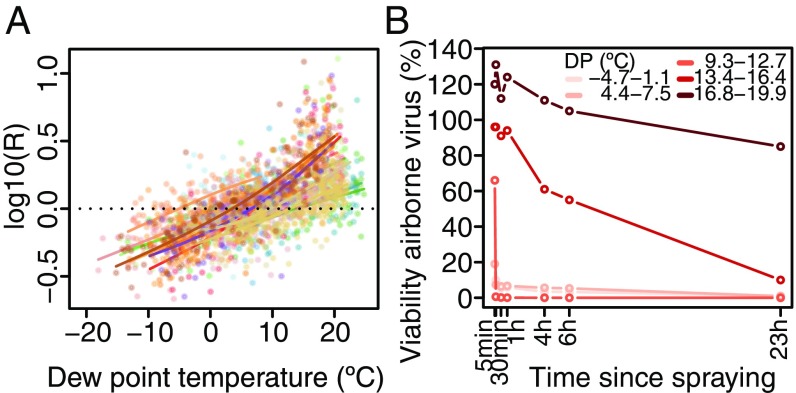
Fig. 5.
Dew point temperature and intensity of transmission. (A) Monthly estimates of the case reproduction number (log10) against monthly mean of dew point. Each color corresponds to a state. The lines are cubic splines for the observations of each state. (B) Effect of dew point (DP) on poliovirus survival. Experimental studies conducted in the early 1960s studied the influence of relative humidity on the survival of poliovirus in aerosols (15). We used data in ref. 15 and an approximation of the dew point based on temperature, relative humidity, and pressure to look at those results for different values of the dew point. This approximation was based on the so-called Magnus formula (39), accounting for an improvement of the saturation water vapor pressure in ref. 40 and using the constants in ref. 41. The lower and upper bounds of the intervals for the dew point were computed using the lower and upper values reported for temperature and relative humidity.

