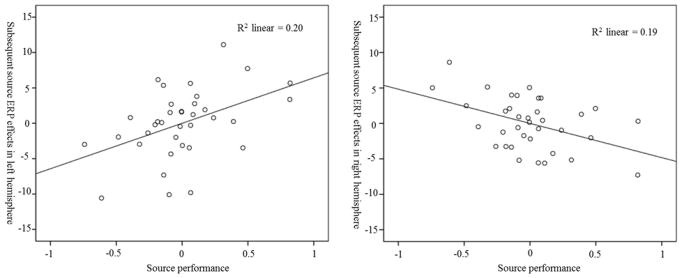
Figure 3.
Scatter plots for the correlations between source performance and subsequent source ERP effects in older children in both left and right hemispheres. Source performance represents normalized source correct percentage. Subsequent source ERP effects refer to the LSW amplitude difference between subsequent source correct trials and subsequent source incorrect trials.

