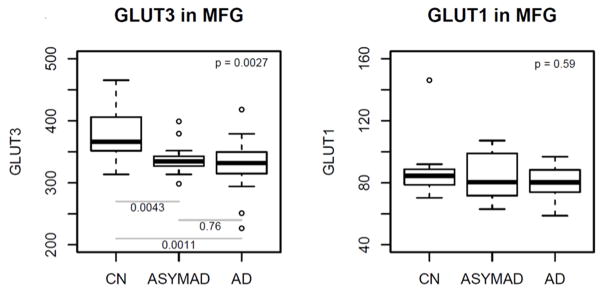
Figure 3. Box plots showing differences in protein levels of the glucose transporters GLUT3 and GLUT1 in the middle frontal gyrus (unadjusted models).
MFG = middle frontal gyrus; GLUT3 = glucose transporter-3; GLUT1 = glucose transporter-1
Upper corner shows the overall p-values comparing all 3 groups and post-hoc pairwise p-values are shown at the bottom

