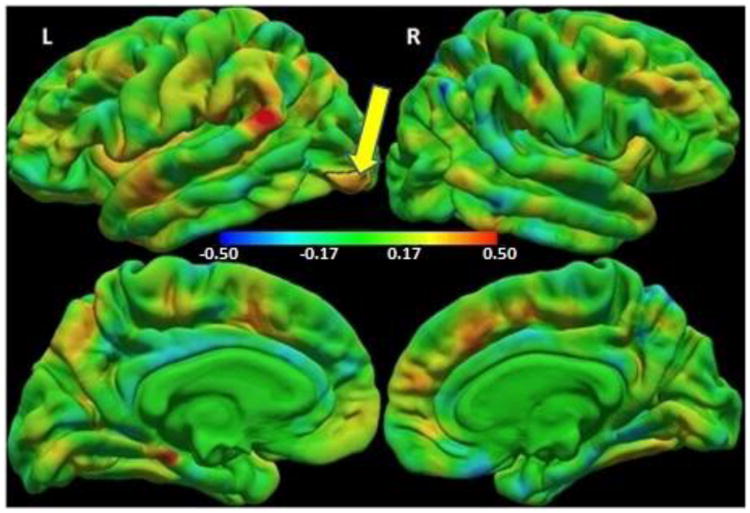
Fig. 1.

Colour map of regression coefficients for cortical thickness (mm) against group (HIV+ children/controls) controlling for sex. Positive regression coefficients (red/yellow) indicate HIV+ > controls, and negative coefficients (cyan/blue) indicate HIV+ < controls. The color bar scale applies to both lateral (top) and medial (bottom) views.
The small left lateral occipital region outlined in black shows where HIV+ children have thicker cortex compared to uninfected controls at a threshold of p<0.05, with a cluster size corrected threshold of p<0.05 (Peak MNI co-ordinates 32.9, -83.4, 1.6, size 865.57 mm2).
