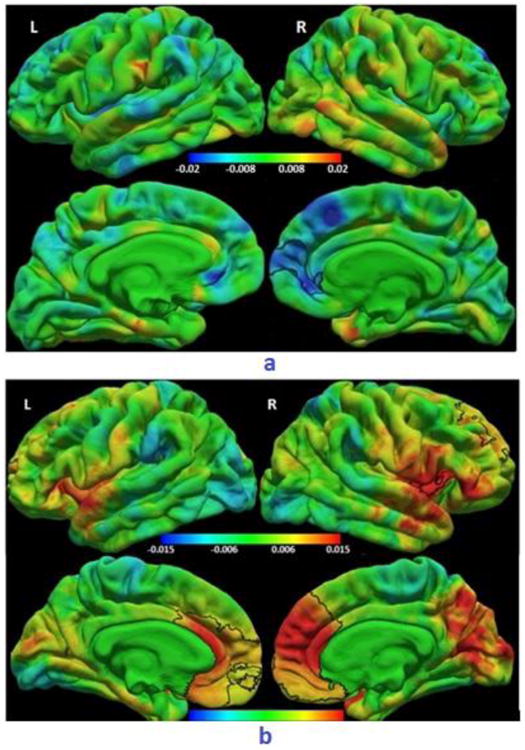
Fig. 4.

a) Colour map of regression coefficients for the regression of cortical thickness (mm) on age at ART initiation (weeks). The cluster outlined in black shows a right medial frontal region where older age at ART initiation was associated with thinner cortex at a threshold of p<0.05, with a cluster size threshold of p<0.05, after controlling for sex and duration of interruption. (Right rostral anterior cingulate/ medial orbitofrontal/ superior frontal/ frontal pole/ rostral middle frontal gyri, MNI co-ordinates 10.3, 51.2, 3.3, size 882.87 mm2). A similar region showed thinner cortex in After-12wk children compared to Before-12wk children. The same color bar scale applies to all views.
b) Colour map of regression coefficients for LGI on age at ART initiation (weeks). Clusters outlined in black show (top) right lateral fronto-temporal (right pars orbitalis/ pars triangularis/ lateral orbitofrontal/ insula/ superior temporal, MNI co-ordinates 43.2, -0.8, -18.7, size 838.81 mm2) and (bottom) bilateral medial frontal (left: medial orbitofrontal/ rostral anterior cingulate/ caudal anterior cingulate/ superior frontal/ frontal pole/ rostral middle frontal, MNI co-ordinates -5.7, 29.6, 13.6, size 3609.06 mm2; right: caudal anterior cingulate/ rostral anterior cingulate/ medial orbitofrontal/ superior frontal/ rostral middle frontal/ frontal pole, MNI co-ordinates 14.7, 39.0, 9.2, size 5285.53 mm2) regions where older age at ART initiation was associated with greater LGIs at a threshold of p<0.05, with a cluster size threshold of p<0.05, after controlling for sex and duration of interruption. Similar regions showed greater gyrification in After-12wk children compared to Before-12wk children. Note different color bar scales for lateral (top) and medial (bottom) views.
