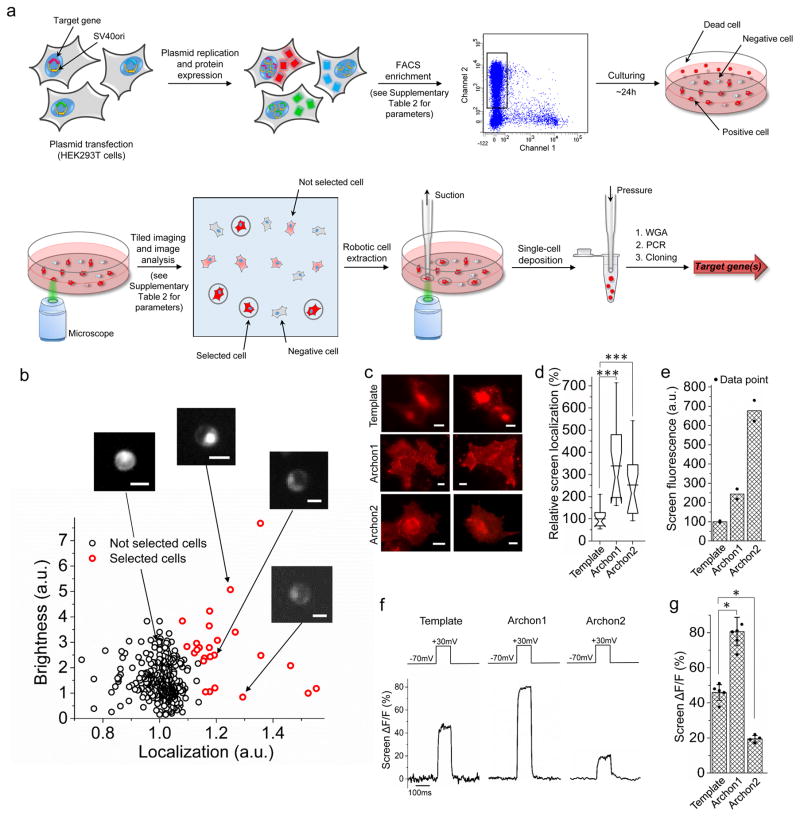
Figure 1. Multi-parameter directed evolution of proteins in mammalian cells via robotic cell picking.
(a) Pipeline for multi-parameter directed evolution of proteins in mammalian cells using robotic cell picking. Abbreviations: FACS, fluorescence-activating cell sorting (FACS); WGA, whole-genome amplification. (b) Example data and analyses reflecting the quantitative metrics used in the cell-picker step during the second round of directed evolution, for simultaneous optimization of brightness and localization. Scale bar: 10 μm. (c) Representative fluorescence images of HEK293T cells expressing the template, Archon1 and Archon2 (n = 15, 16, and 16 cells for Archon1, Archon2, and the template respectively). Dynamic ranges for the images were normalized to facilitate visual comparison. Scale bars, 5μm. Imaging conditions: 62 mW/mm2, λex = 628/31BP (bandpass, used throughout) from an LED, λem= 664LP (longpass, used throughout) used in (c,d). (d) Relative membrane localization of the indicators of c in HEK293T cells (n = 15, 16, and 16 cells for Archon1, Archon2, and the template respectively, each from 2 independent transfections; ***P < 0.0001 for Archon1 and ***P = 0.0003 for Archon2, Kruskal-Wallis analysis of variance followed by post-hoc test via Steel’s test with the template as control group). Box plots with notches are used throughout this paper, when n > 6, as recommended by ref40 (narrow part of notch, median; top and bottom of the notch, 95% confidence interval for the median; top and bottom horizontal lines, 25% and 75% percentiles for the data; whiskers extend 1.5 times the interquartile range from the 25th and 75th percentiles; horizontal line, mean). (e) FACS mean fluorescence intensity for sets of live HEK293T cells expressing these indicators (n = 2 transfected samples, each; individual data points in black dots). (f) Representative fluorescence changes for these indicators with a 100 mV voltage step, measured in HEK293T cells. Imaging conditions: λex = 637nm laser light, λem= 664LP, 800 mW/mm2 used for the template and 80–800 mW/mm2 used for Archons in (f,g), with light intensity adjusted to prevent signal saturation. (g) Population data of fluorescence changes, as in f, for these indicators (n=5, 6, and 4 cells for the template, Archon1, and Archon2, each from 2 independent transfections; individual data points in black dots; error bars, standard deviation; *P = 0.0155 for Archon1 and *P = 0.0374 for Archon2, Kruskal-Wallis analysis of variance followed by post-hoc Steel’s test with the template as control group), taken in the steady state.

