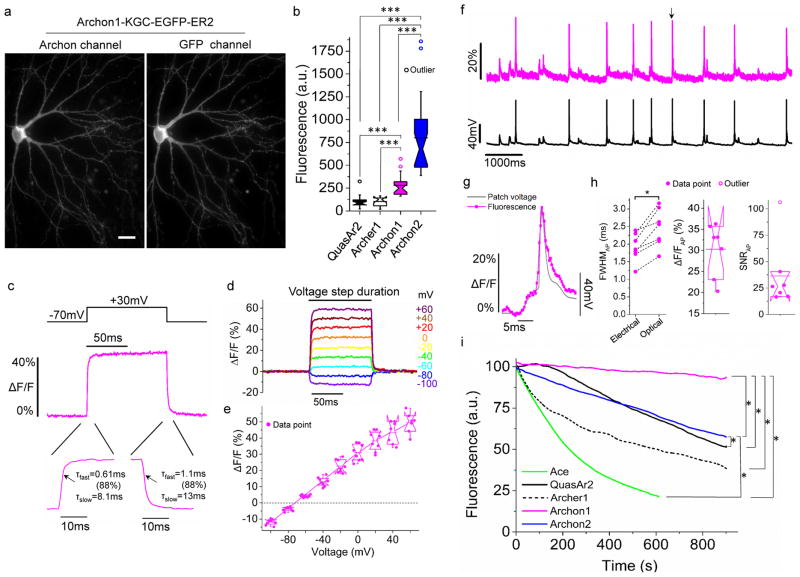
Figure 2. Characterization of Archons in cultured cells.
(a) Representative fluorescent images of Archon1 (left, excitation (λex) with 637 nm laser light, emission (λem) at 664LP) and GFP (right, λex = 475/34BP from an LED and λem = 527/50BP) channels in a cultured mouse hippocampal neuron (n = 32 cells from 5 independent transfections). Scale bar: 10 μm. (b) Relative fluorescence of QuasAr2, Archer1, Archon1, and Archon2 in cultured neurons (n = 18, 16, 23, and 23 cells respectively, from 4 independent transfections each, from one culture; λex = 637nm laser light at 800 mW/mm2 and λem = 664LP for Fig. 2c–g; ***P < 0.0001, Kruskal–Wallis analysis of variance followed by post-hoc Steel-Dwass test on each pair; see Supplementary Table 5 for full statistics for Fig. 2). Box plots with notches are used (see caption of Fig. 1d for description). Open circles represent outliers, data points which are less than 25th percentile or greater than 75th percentile by more than 1.5 times the interquartile range. (c) Representative fluorescence response of Archon1 in a cultured neuron, to a 100 mV change delivered in voltage-clamp. τfast and τslow indicate time constants with the fluorescence trace fit according to , with the % indicating A/(A+B). Image acquisition rate: 3.2 kHz. (d) Representative fluorescence traces of Archon1 in response to a series of voltage steps in voltage-clamp mode. Image acquisition rate: 2.3 kHz. (e) Population data corresponding to the experiment of d (n = 8 neurons from 3 cultures). Data was normalized so that −70 mV was set to 0 ΔF/F. (f) Single-trial optical recording of Archon1 fluorescence responses (magenta) during spontaneous activity, with concurrent current clamp trace (black), for a cultured hippocampal neuron. Peak marked with arrow is zoomed-in in (g). Image acquisition rate: 2.3 kHz. (g) Zoomed-in view of peak marked with arrow in (f), scaled to match peaks. (h) Quantification of electrical and optical full width at half maximum (FWHM; dashed lines connect data points from same neuron), ΔF/F, and signal-to-noise ratio (SNR), per action potential (AP) across all recordings (n = 160 APs from 7 neurons from 5 cultures). *P = 0.0156, Wilcoxon signed-rank test. (i) Photobleaching curves of Ace, QuasAr2, Archer1, Archon1 and Archon2 under continuous illumination (n= 5, 7, 5, 9, and 7 neurons from 1, 1, 1, 2, and 2 cultures, respectively; 475/34BP from an LED at 13 mW/mm2 for Ace2N-4aa-mNeon, 637nm laser light at 2.2W/mm2 for QuasAr2 and Archer1, 637nm laser light at 800mW/mm2 for Archon1 and Archon2; light intensity was adjusted to have the same initial signal-to-noise ratio (SNR) of action potentials, e.g. 25±8, 26±12, 26±10, 26±10 and 28±7 for Quasar2, Archer1, Archon1, Archon2 and Ace2N-4aa-mNeon respectively; image acquisition rate: 333Hz); *P = 0.0184 for Archon1 and Archon2, Archon1 and QuasAr2, and Archon2 and QuasAr2; *P = 0.0456 for Archon1 and Archer1, Archon1 and Ace, and Archon2 and Ace; Kruskal–Wallis analysis of variance of bleaching time followed by post-hoc Steel-Dwass test on each pair).

