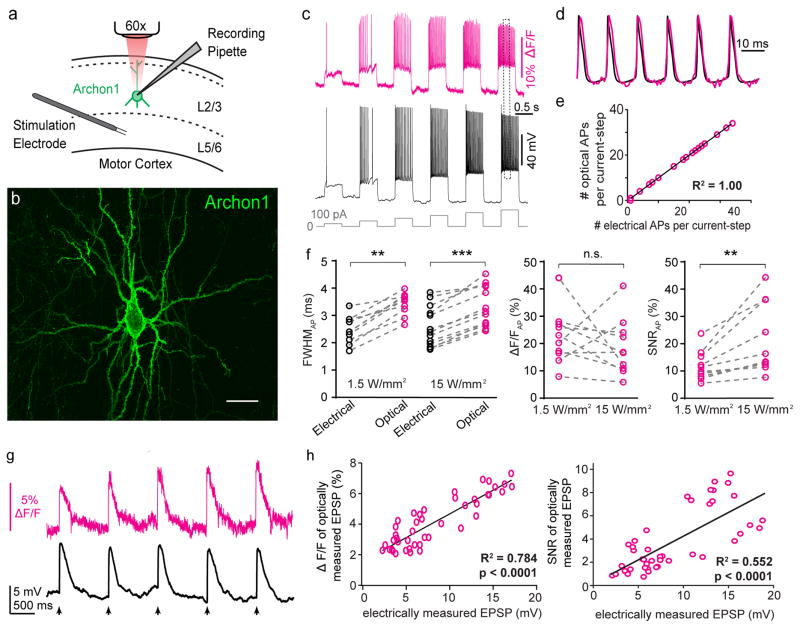
Figure 3. Millivolt-scale imaging of neural voltage in intact brain slices.
(a) Schematic of experimental recording configuration. Archon1-expressing pyramidal neurons in layer (L) 2/3 of motor cortex were targeted by patch-clamp recording, and Archon fluorescence at the soma was imaged at 1 kHz. Excitation intensity was ~7 mW over the area of the soma (i.e., ~15 W/mm2 at 637 nm, but 10x lower intensity, 1.5 W/mm2 at 637nm, was used in Fig. 3f for comparison). A bipolar stimulation electrode was in some experiments placed in L5 to trigger excitatory synaptic events in Archon1-expressing L2/3 pyramidal neurons. (b) Representative image of Archon1 expressing neuron in L2/3 of mouse motor cortex (n = 70 slices from 3 mice). Scale bar: 25 μm. (c) A series of 500 ms current steps with increasing amplitudes (from 100 to 600 pA, in 100pA increments; gray line) were injected through the recording pipette, resulting in action potentials of varying frequency. Magenta, imaged trace; black, simultaneous whole-cell patch-clamp in current clamp mode. (d) Zoomed-in view of APs marked with dotted box in c, scaled to match peaks. (e) Graph of the number of optically detected APs vs. the number of electrically detected APs for every 500 ms-long current injection across all cells that underwent the experiment of c (n = 22 steps from 5 neurons); straight line indicates linear regression. (f) Quantification of electrical and optical full width at half maximum (FWHM, left), ΔF/F (middle), and SNR (right) for action potentials; n = 10 neurons from 6 mice; means are plotted for each cell; dashed lines connect data points from same neuron; Wilcoxon signed-rank test: **P = 0.002 and ***P = 0.0002 for FWHM, P = 0.375 (not significant, n.s.) for ΔF/F, **P = 0.002 for SNR, see Supplementary Table 5 for full statistics for Fig. 3. (g) Representative optical (magenta) and electrical (black) signals from electrically evoked excitatory postsynaptic potentials (EPSPs). Arrows indicate times of stimulation (5 stimuli at 1 Hz, followed by inter-trial intervals of >30 seconds). (h) Population data of ΔF/F (left) and SNR (right) from individual EPSPs as in (g) across all cells (n = 45 EPSPs from 4 neurons from 2 mice); straight line indicates linear regression.

