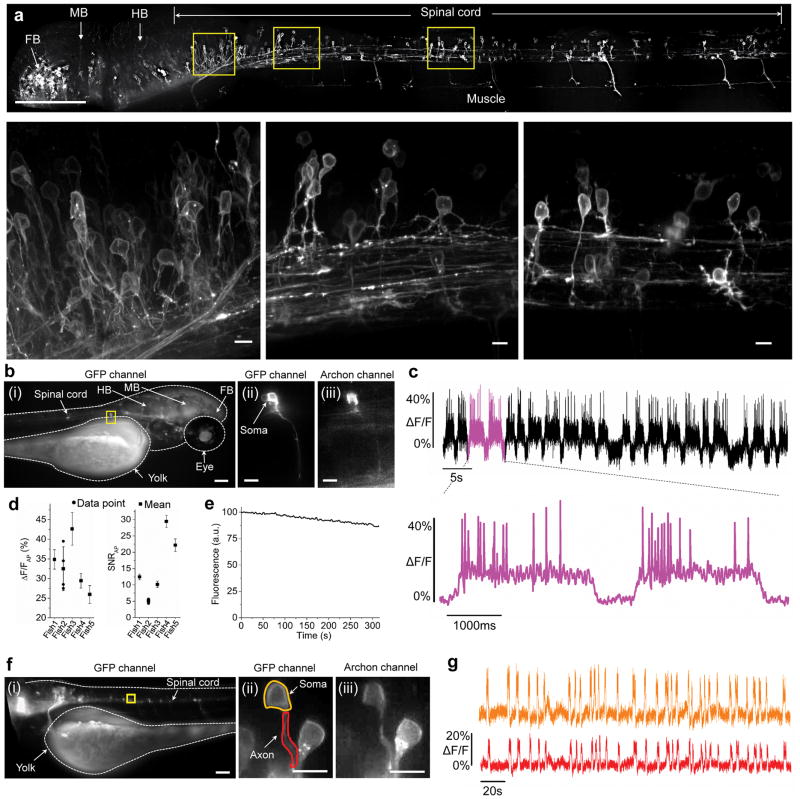
Figure 4. Voltage imaging of Archon1-expressing neurons in larval zebrafish.
a Representative fluorescence image (top; GFP channel: excitation (λex) at 465 nm laser light, emission (λem) at 527/50BP) of neurons expressing zArchon1-EGFP in the spinal cord of a zebrafish larva at 3 days post fertilization (dpf) (n = 4 fish). Yellow boxes indicate neurons zoomed-in in the bottom panels. Scale bar, 125 μm. FB, forebrain; MB, midbrain; HB, hindbrain. (Bottom) From left to right: high magnification images of the neurons highlighted in the yellow boxes in the top panel. Scale bar, 5 μm. (b) Representative image (i, λex = 475/34BP from an LED, λem = 527/50BP) of neurons expressing zArchon1-GFP in the spinal cord of a 4 dpf zebrafish larva immobilized in agarose under wide-field microscopy (n = 5 fish). The yellow box indicates a neuron zoomed in in later panels. Scale bar: 100 μm. (ii) High magnification image of the neuron highlighted in the yellow box of (i) in the GFP channel. Scale bar: 10μm. (iii) As in ii, but in the Archon (λex = 637 nm laser light, λem = 664LP) channel. (c) Representative fluorescence trace (top) of zArchon1 reporting spontaneous activity of the neuron shown in b (at soma; λex = 637 nm laser light at 2.2 W/mm2, λem = 664LP; image acquisition rate: 500 Hz; n = 5 neurons from 5 fish). Bottom, the section of b highlighted in magenta, shown at an expanded time scale. (d) Population data of fluorescence changes and signal-to-noise ratios of zArchon1 during action potentials (APs; n = 21, 4, 132, 71 and 58 action potentials for fish 1–5, respectively; plotted is mean and standard deviation for each fish; raw data points are shown for fish with n <10 APs). (e) Photobleaching of zArchon1 fluorescence measured in in vivo in zebrafish larvae (n = 11 neurons from 6 fish) over 300 s of continuous illumination at 2.2 W/mm2. (f) Representative image (in the GFP channel) of neurons expressing zArchon1 in the spinal cord of a zebrafish larva at 4 dpf immobilized in agarose under wide-field microscopy (n = 3 fish). A yellow box indicates neurons zoomed in in later panels. Scale bar: 100μm. (ii) High magnification image of the neurons highlighted in the yellow box of (i) in the GFP channel. Scale bar: 10um. Highlighted regions indicate the soma (yellow) and the axon (red) of the neuron of interest. (iii) As in ii, but in the Archon channel. (g) Representative fluorescence trace of zArchon1 reporting spontaneous activity at the soma and the axon of the neuron shown in f (n = 3 neurons from 3 fish). The traces were acquired at the soma (yellow) and the axon (red) of the neuron (λex = 637 nm laser light at 2.2 W/mm2, λem = 664/LP, image acquisition rate: 250 Hz).

