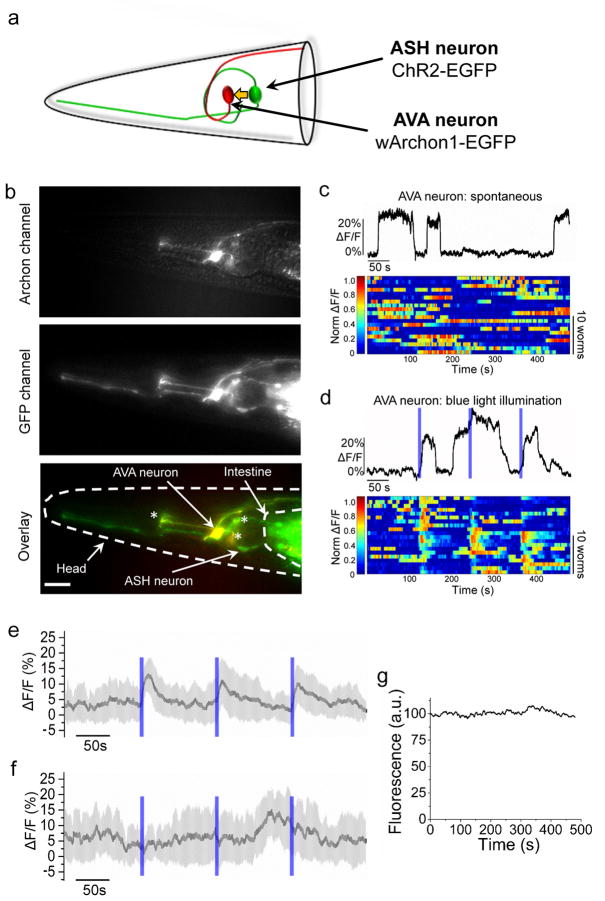
Figure 5. All-optical electrophysiology in C. elegans.
(a) Schematic of AVA neuron expressing wArchon1-EGFP (red) and ASH neuron expressing ChR2-EGFP (green), in the head of C. elegans. A yellow arrow indicates synaptic connection from ASH onto AVA. (b) Fluorescence images of the C. elegans head expressing wArchon1-EGFP in an AVA neuron (under rig-3 promoter) and ChR2-GFP (under sra-6 promoter) in the ASH neuron (top, Archon channel; middle, GFP channel; bottom, overlay), as well as pharyngeal neurons that express wArchon1-EGFP under control of the rig-3 promoter (asterisks; n = 20 worms). Scale bar: 20 μm. (c; top) A representative trace of wArchon1 fluorescence reporting spontaneous activity in the soma of an AVA neuron (n = 20 cells from 20 worms). (Bottom) Individual traces of wArchon1 fluorescence reporting spontaneous activity in an AVA neuron (n=20 neurons in 20 worms). (d; top) A representative trace of wArchon1 fluorescence in soma of an AVA neuron under three pulses of blue light stimulation (0.2 mW/mm2, λex=475/34BP light from an LED, 6 s; blue bars). (Bottom) Individual traces of wArchon1 fluorescence in an AVA neuron under blue light illumination (n=20 neurons in 20 worms). (e) Averaged wArchon1 fluorescence changes for traces presented in panel d. Shaded area is standard deviation. (f) Averaged wArchon1 fluorescence changes for traces recorded under same conditions as in panel d using the worms expressing only wArchon1-EGFP in AVA neurons. Shaded area is standard deviation. (g) Photobleaching curve of wArchon1 expressed in AVA neurons under continuous 637 nm excitation illumination (n = 10 cells from 10 worms, λex = 637 nm laser light at 800 mW/mm2, λem = 664LP).

