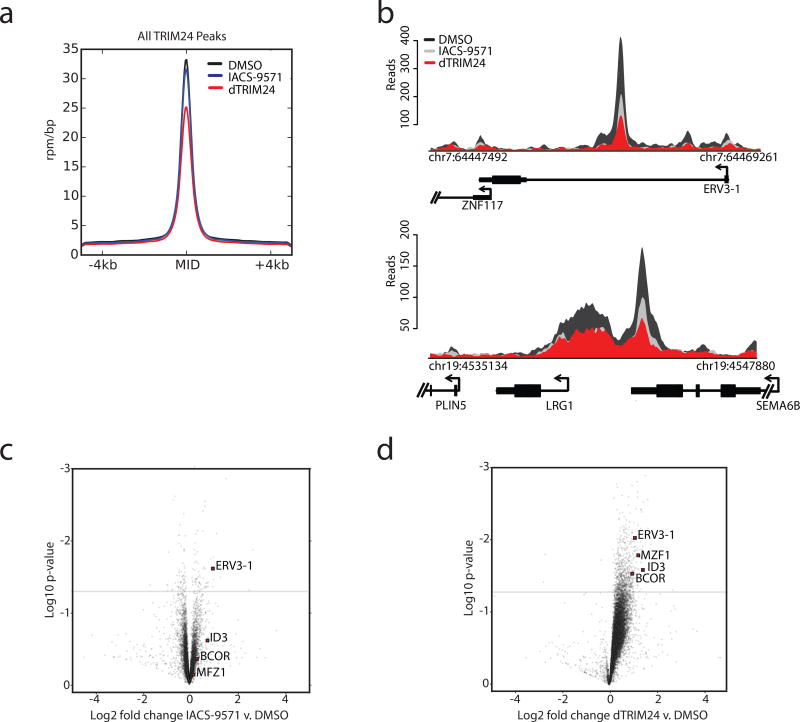
Figure 5. Global displacement of TRIM24 from chromatin and transcriptional response to TRIM24 degradation.
(a) Average genome-wide reads for TRIM24 centered on a ± 4 kb window around the TRIM24 peaks with the indicated treatment conditions (2.5 µM) for 24 hours. The y-axis shows ChIP-Rx signal (rpm/bp) and the x-axis indicates position. (b) ChIP-seq binding density of TRIM24 at exemplary asymmetrically loaded TRIM24 loci following the indicated treatments for 24 hours. The y-axis indicates ChIP-seq signal (rpm/bp) and the x-axis indicates genomic position. For a–b n=1 independently conducted experiment. (c) Gene expression change represented by Log2 fold change of transcripts versus Log10 p-value after 24 hours of 2.5 µM IACS-9571 treatment. Expression values were normalized to cell number using ERCC spike-in controls. (d) As described in (c), with dTRIM24 treatment. For c–d, data represents biological triplicates.

