Fig. 3.

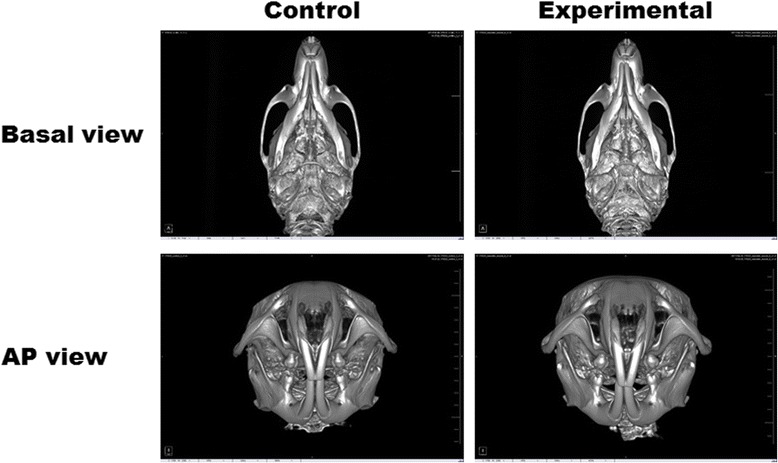
Micro-computed tomography of rats. Basal view and anteroposterior view are shown for the control group (saline-injected) and the experimental group (BTX-A-injected)

Micro-computed tomography of rats. Basal view and anteroposterior view are shown for the control group (saline-injected) and the experimental group (BTX-A-injected)