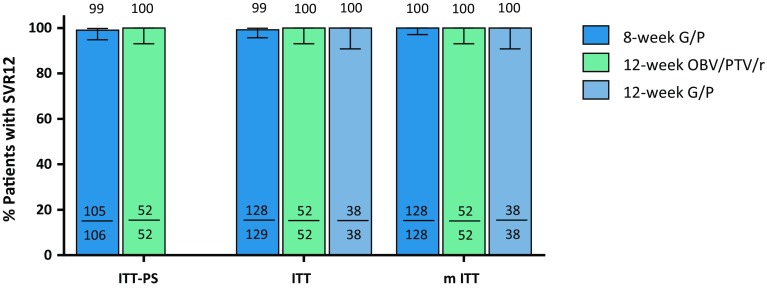
Fig. 2.
SVR12 rates for each arm in the ITT-PS, ITT and mITT populations. The error bars represent the 95% confidence intervals based on Wilson’s score method. Arm A: 8-week G/P treatment; Arm B: 12-week OBV/PTV/r treatment; Arm C: 12-week G/P treatment. SVR sustained virologic response; ITT intent-to-treat; ITT-PS ITT population excluding patients with the NS5A Y93H baseline polymorphism; mITT ITT excluding patients who did not achieve SVR12 for reasons other than virologic failure

