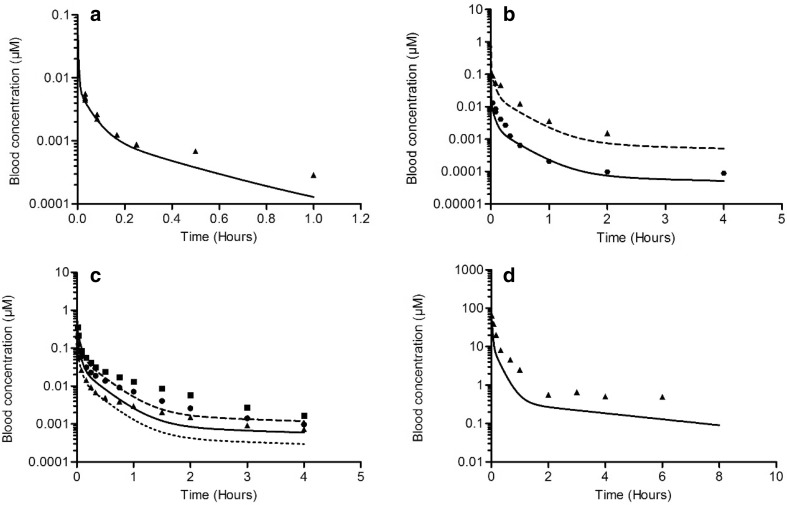
Fig. 2.
Blood concentrations of E2 (a–c) and BPA (d) in rats upon intravenous administration. Symbols represent the average blood concentrations from in vivo studies reported in the literature. Lines represent blood concentrations predicted by the PBK model. Dose levels are as follows: a E2, 0.0056 mg/kg bw (triangles, straight line) (Larner and Hochberg 1985); b E2, 0.01 mg/kg bw (circles, straight line) and 0.1 mg/kg bw (triangles, dashed line) (Eisenfeld 1967); c E2, 0.02 mg/kg bw (triangles, dotted line), 0.04 mg/kg bw (circles, straight line) and 0.08 mg/kg bw (squares, dashed line) (Bawarshi-Nassar et al. 1989); d BPA, 10 mg/kg bw (triangles, straight line) (Upmeier et al. 2000)

