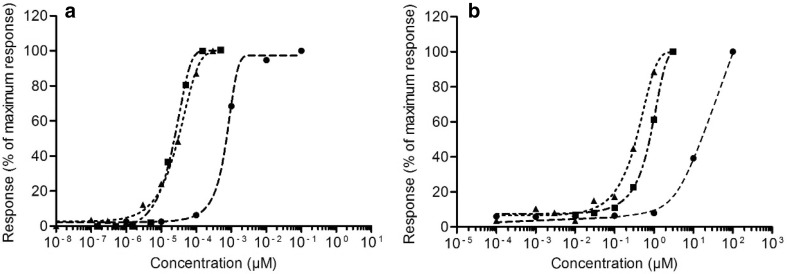
Fig. 5.
In vitro concentration-response curves of E2 (a) and BPA (b). The response is shown as a percentage of the maximum response induced by the chemical. Data derived from different in vitro assays shown with different symbols are as follows: MCF-7/BOS proliferation assay (triangles, dotted line), U2OS ER-CALUX assay (squares, dash-dotted line) and YES assay (circles, dashed line)

