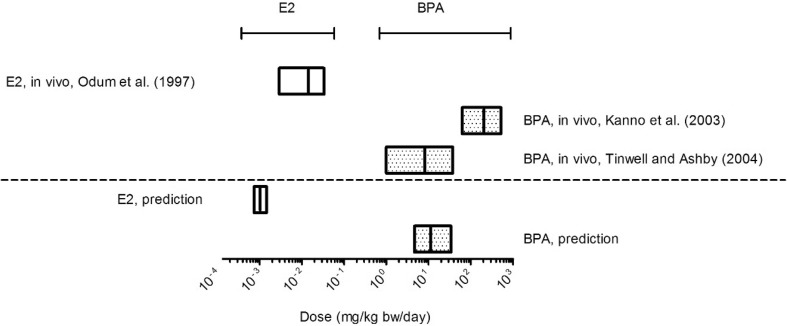
Fig. 7.
Comparison of the BMD10 values (including BMDL10 and BMDU10 values) from predicted dose–response and in vivo dose-response data of E2 (empty box) and BPA (dotted box). Predicted dose–response data were obtained by PBK modelling-based reverse dosimetry of in vitro data from the YES assay and in vivo data were obtained from uterotrophic assay studies reported in the literature (E2: (Odum et al. 1997), BPA: (Kanno et al. 2003) and (Tinwell and Ashby 2004)). BMD analysis was performed using the BMR as a 10% response change as compared to the control using PROAST. The results are presented as the range between the BMDL10 and BMDU10 values reported, giving the BMD10 values as straight line in between

