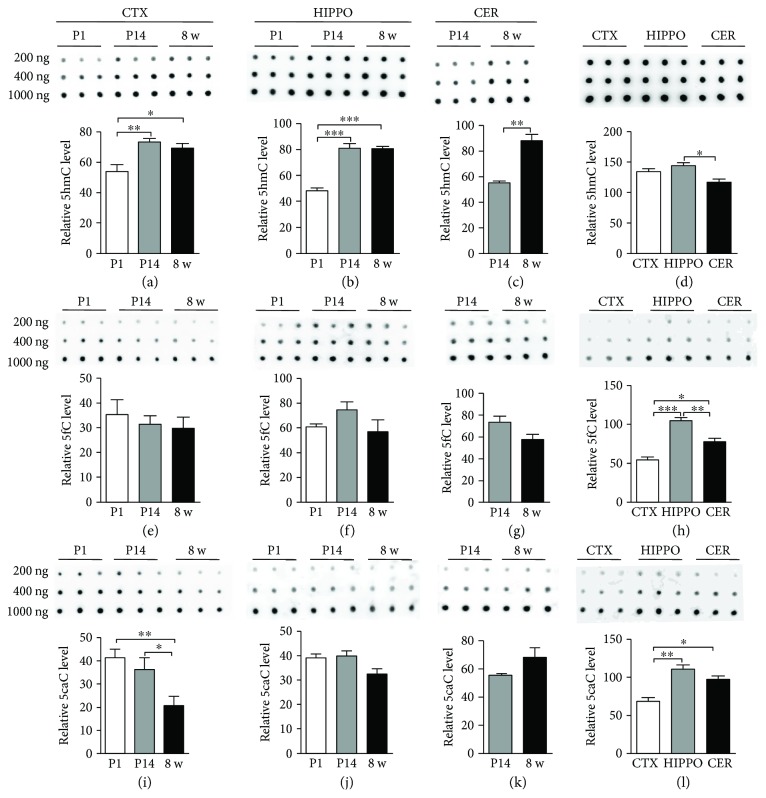
Figure 2.
5hmC, 5fC, and 5caC in different brain regions using DNA dot blot. The relative levels of 5hmC, 5fC, and 5caC in the P1, P14, and 8 w cortex ((a), (e), (i)), hippocampus ((b), (f), (j)), and cerebellum ((c), (g), (k)). Comparison of 5hmC (d), 5fC (h), and 5caC (l) levels between different brain regions at 8 w. Data are represented as mean ± SEM (n = 3). Statistically significant differences were indicated: ∗ p < 0.05, ∗∗ p < 0.01, and ∗∗∗ p < 0.001.

