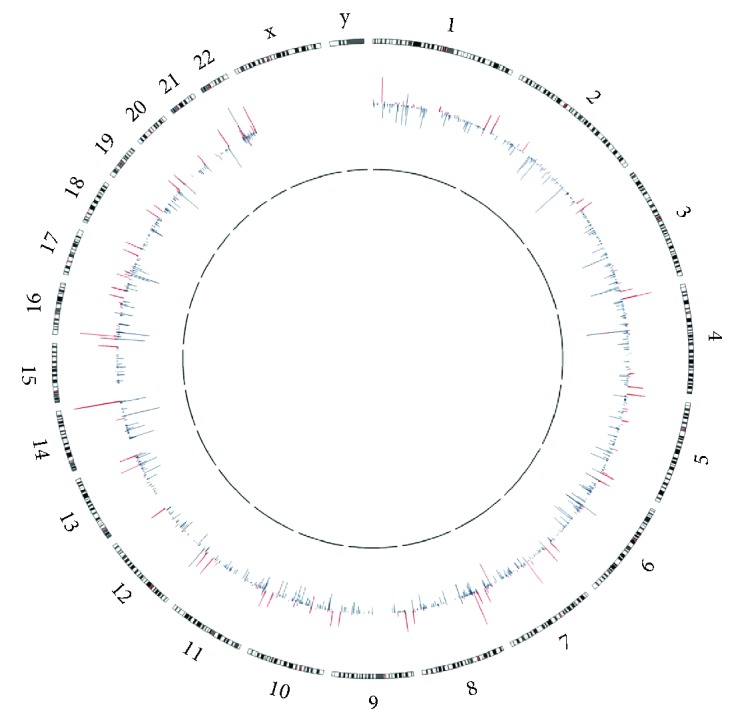
Figure 1.

Genome-wide distribution of CNV genes. The outer circle represented chromosome numbers and ideograms; the inner circle represented copy number variations at corresponding chromosome loci. Outward red bars depicted amplifications, and inward green bars depicted deletions. The graph was plotted using Circos.
