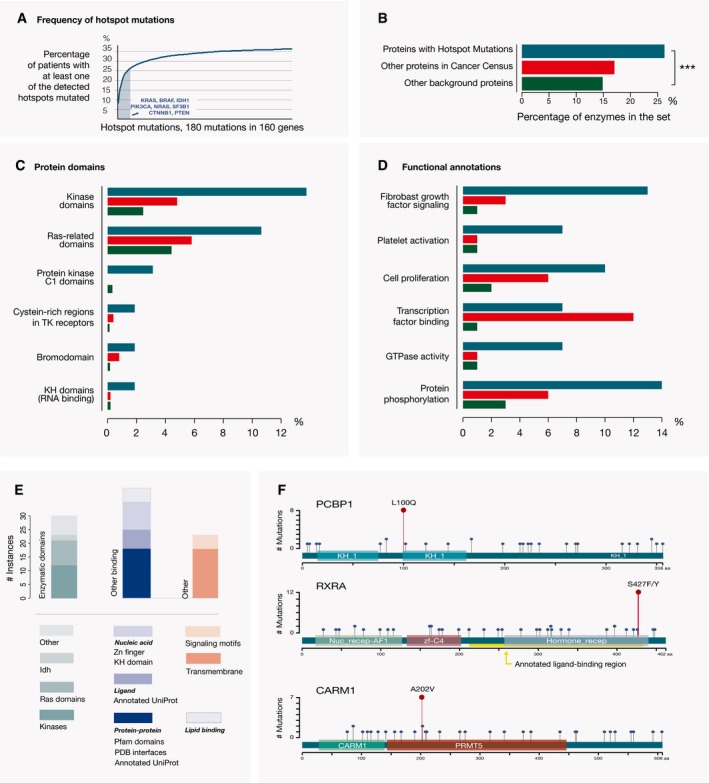
A high fraction of the sequenced samples (i.e., 36%) have at least one of the detected hotspot residues mutated. Strong contributors to this signal are the listed known cancer drivers with hotspots. Hotspots in one or more of these proteins are mutated in 27% of the analyzed tumor samples.
Proteins with hotspot mutations (dark cyan) have a higher fraction of enzymes than other proteins in the Cancer Gene Census (light red, P < 0.015) or all other human proteins (dark green, ***P < 10−4, chi‐squared test). Color representation of proteins from the three sets follows the same scheme on all the following figures.
Protein domains that are significantly overrepresented among the proteins with hotspot mutations compared to the non‐cancer background proteins (adjusted P ≤ 0.01, Fisher's test).
Protein annotations (GO terms) that are overrepresented among the proteins with hotspots compared to the non‐cancer background proteins (adjusted P < 10−4, Fisher's test). Transcription factor binding and several other terms related to regulation of gene expression are more abundant among the other proteins in the Cancer Gene Census than among the genes with hotspots.
Hotspot mutations that mapped to the functionally similar protein segments in two or more different proteins are classified depending on whether the mutation occurred within a protein domain with an enzymatic function (first column), another region in the protein that can mediate binding to other proteins, nucleic acids, ligands or lipids, or in a region that contains a signaling motif or a transmembrane segment.
Examples of individual proteins of interest. PCBP1, RXRA, and CARM1 are functionally related to cancer‐relevant processes and have hotspot mutations (dark red circles) within the RNA binding KH domain, ligand‐binding segment, and enzymatic domain, respectively. Other missense mutations in these proteins are depicted as blue circles. Pfam protein domains encoded by these genes are shown as colored boxes.

