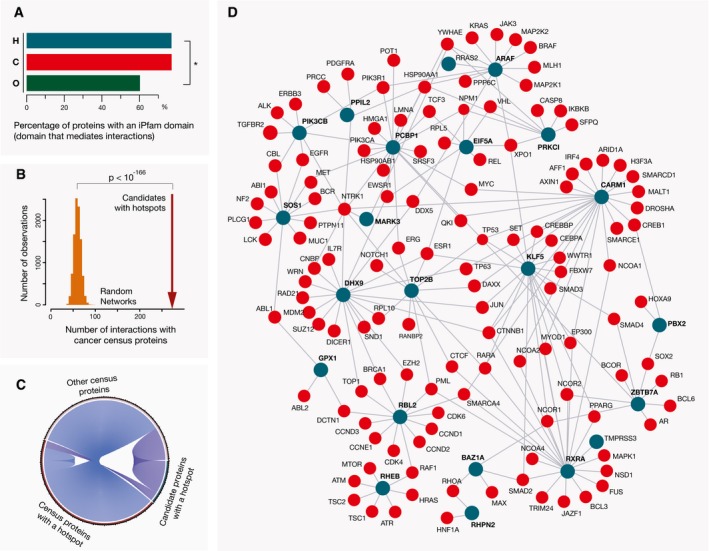
Figure 4. Proteins with hotspot mutations are often in the interaction networks with known cancer driver proteins.

- A fraction of genes with hotspot mutations (H) that encode interaction domains is comparable to the fraction of genes in the Cancer Gene Census that encode the same domains (C) and is significantly higher (*P < 10−4, chi‐squared test) than the fraction of other background genes (O), with these domains.
- Direct interaction partners of candidate cancer proteins with hotspot mutations (i.e., those that are not in the Cancer Gene Census) are significantly enriched in known cancer drivers. Distribution of values for the random networks of the same size is shown as an orange histogram (1,000 networks obtained with resampling of the interactors), and the observed physical interactions between the hotspot candidates and Cancer Gene Census proteins (i.e., 273) are indicated with a dark red arrow (P < 10E‐166, pnorm test).
- Candidate cancer proteins with a hotspot mutation often interact both with cancer drivers with a hotspot mutation as well as with other Cancer Gene Census proteins.
- Candidate proteins with hotspot mutations whose interaction neighborhoods were enriched in cancer driver proteins (adjusted P < 0.05, Fisher's test) are shown as dark cyan circles and denoted in a bold font. Their Cancer Gene Census interaction partners are shown as red circles.
