Figure 3.
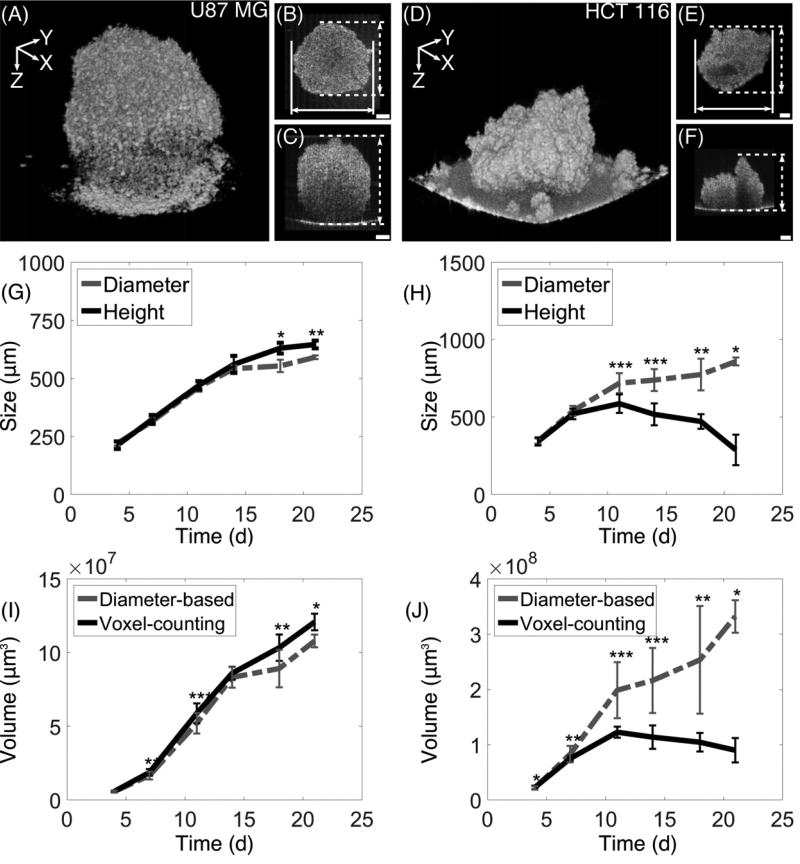
Quantitative analysis of the growth kinetics of 3D tumor spheroids in terms of size (diameter and height) and volume. (A–F) Two tumor spheroids from U-87 MG and HCT 116 cell lines at Day 18 were shown as examples to illustrate how average diameter and height were measured from en face and cross-sectional OCT images. Growth curves of U-87 MG (G) and HCT 116 (H) tumor spheroids were shown. While similar growth trends of average diameter and height were revealed for U-87 MG spheroids in (G), discrepancy between average diameter and height of HCT 116 tumor spheroids after Day 11 was observed in (H), in consistence with our finding of heterogeneous geometry in OCT images (D–F). Comparisons of growth curves of the volume of U-87 MG (I) and HCT 116 (J) tumor spheroids between voxel-based measurements and diameter-based measurements were shown. While volumes obtained from both methods were similar for U-87 MG tumor spheroids throughout 21 days, volumes of HCT 116 tumor spheroids were significantly over-estimated with diameter-based measurements compared to voxel-based measurements, especially after Day 11. Scale Bars: 100 µm.

