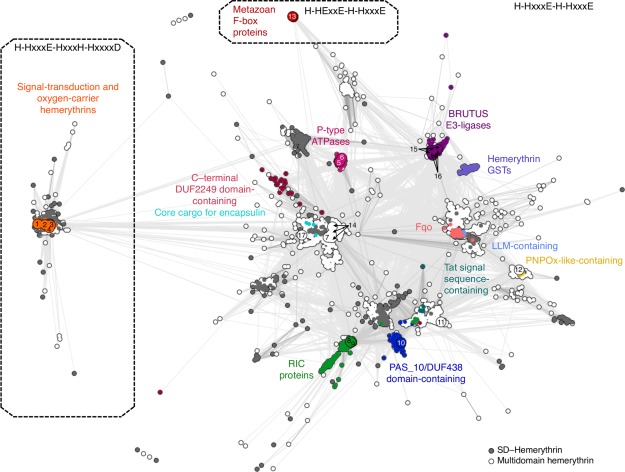
Figure 2.

Cluster map of hemerythrin homologs. Cluster map of 6599 hemerythrin sequences in two‐dimensional space at a P value cutoff of 1e‐10. Dotted lines enclose three large groups formed at a P value cutoff of 1e‐13. Each dot represents a sequence; dots are colored by groups of sequences with known domain organization. (1) Q9PIQ3 and (2) Q0P932 from Campylobacter jejuni; (3) Q60AX2 from Methylococcus capsulatus, and Q726F3 from Desulfovibrio vulgaris; (4) Q9KSP0 from Vibrio cholerae; (5) Q9RJ01 from Streptomyces coelicolor; (6) Q92Z60 from Rhizobium meliloti; (7) Q8YS92 from Nostoc sp.; (8) P69506 from Escherichia coli; (9) Q7WX96 from Cupriavidus necator; (10) Q8U2Y3 from Pyrococcus furiosus; (11) A0KMZ0 from Aeromonas hydrophila; (12) Q9JYL1 from Neisseria meningitidis; (13) Q9UKA1 from Homo sapiens; (14) A0QXI3, A0R5J3, A0QV17 from Mycobacterium smegmatis; (15) Q8LPQ5 from Arabidopsis thaliana; (16) V9G2Z0 from Oryza sativa; and (17) Rv2633c from Mycobacterium tuberculosis.
