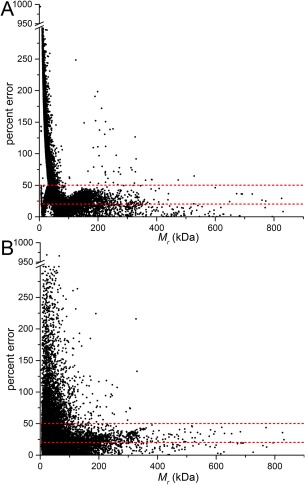
Figure 1.

Analysis of the uncertainty in the molecular mass from empirical methods. (A) A scatterplot showing the percent error between total M r of the biological assembly and the M r calculated using the Vp/1.6 rule [Eq. (1)]. (B) A scatterplot of percent error between total M r of the biological assembly and the M r calculated using the power law rule [Eq. (4)]. The dashed lines are drawn at 20 and 50% error.
