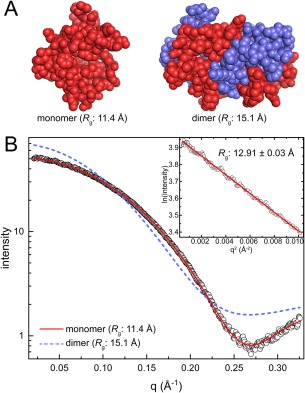
Figure 3.

Case 1: distinguishing between a monomer and a dimer. (A) Models of the polcalcin phl p7 monomer from NMR (PDB ID 2LVK) and the crystallographic dimer (PDB ID 1K9U). Protomers in the dimer model are colored differently for clarity. (B) Experimental SAXS data (open circles) collected at a single concentration of polcalcin phl p7. The inset shows the Guinier plot. Theoretical curves calculated from the polcalcin NMR monomer (red solid line; FoXS χ: 1.5) or dimer (slate dashed line; FoXS χ: 24) are shown.
