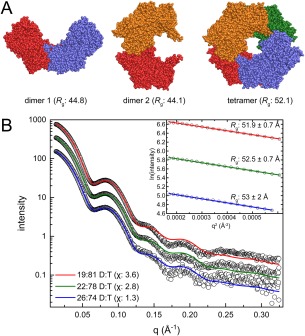
Figure 6.

Case 4: A subtle dimer–tetramer equilibrium. (A) Models of proline utilization A from Bradyrhizobium japonicum derived from the crystal lattice (PDB ID 3HAZ). Protomers are colored differently for clarity. (B) Experimental SAXS data (open circles) collected at three increasing protein concentrations. The inset shows the Guinier plots for each concentration. MultiFoXS fits using an ensemble model of dimer 1 and the tetramer are shown for each concentration. The dimer 1:tetramer (D:T) ratios determined by MultiFoXS are indicated in the legend with the χ value for the each fit in parentheses.
