
Figure 9.
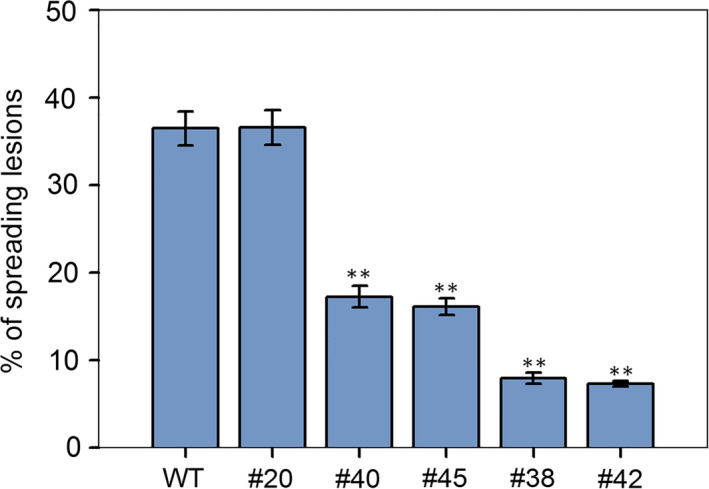
The percentage of spreading lesions counted at 5 days after inoculation. Lines #20 had the T‐DNA insertion, but no mutations. Lines #40 and #45 contained single allele mutations, and lines #38 and #42 contained biallelic mutations. The mean ± SD from three independent experiments is represented by bars. Asterisks indicate the statistical significance between transgenic lines and wild‐type (WT) plants (**P < 0.01, Student's t‐test).