
Figure 2.
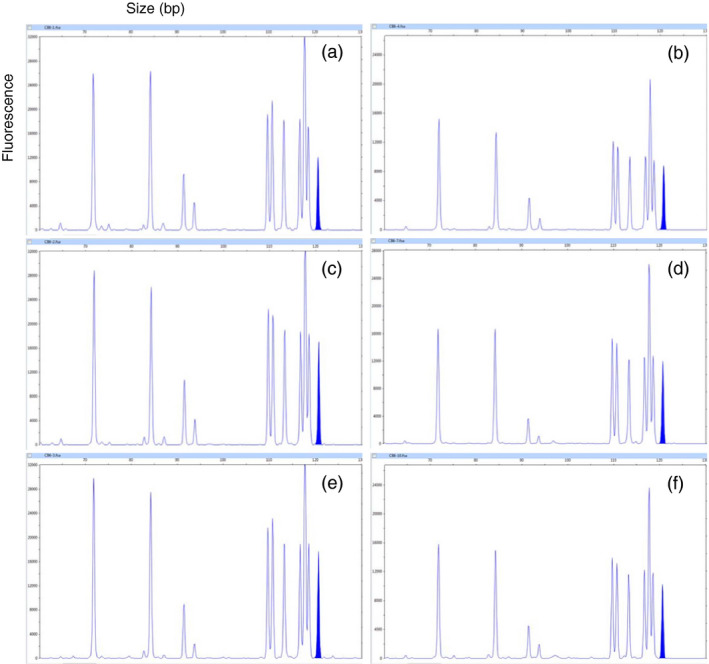
Representative electropherogram for different tillers and different plants of COMT mutant line CB6. (a,b) Two different tillers of the same plant in replication 1. (c,d) Two different tillers of the same plant in replication 2. (e,f) Two different tillers of the same plant in replication 3. Peak representing unmodified COMT is highlighted in blue.