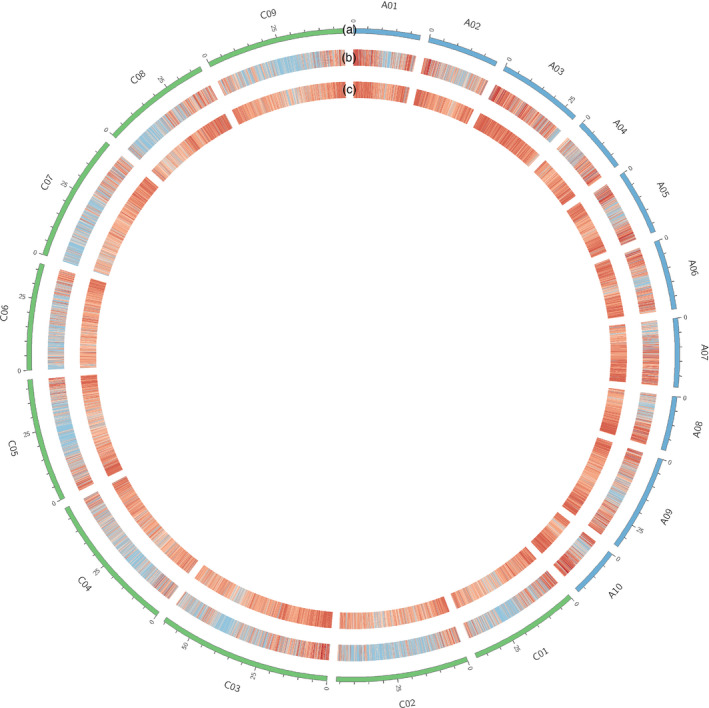
Figure 5.

Canola SNP and gene density heatmaps. Red indicates high density, and blue indicates low density. Tracks displayed are as follows: (a) the canola karyotype; (b) density of SNPs discovered through GBS‐t; and (c) gene density based on the CDS reference genome.
