Figure 6.

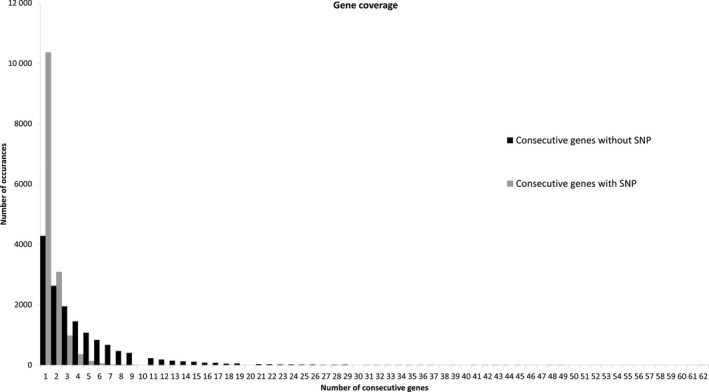
Frequency histogram of distribution of canola genes containing assayed SNPs. Black bars indicate the frequency of consecutive genes without SNPs. Grey bars indicate the frequency of consecutive genes with at least one SNP.

Frequency histogram of distribution of canola genes containing assayed SNPs. Black bars indicate the frequency of consecutive genes without SNPs. Grey bars indicate the frequency of consecutive genes with at least one SNP.