Figure 1.

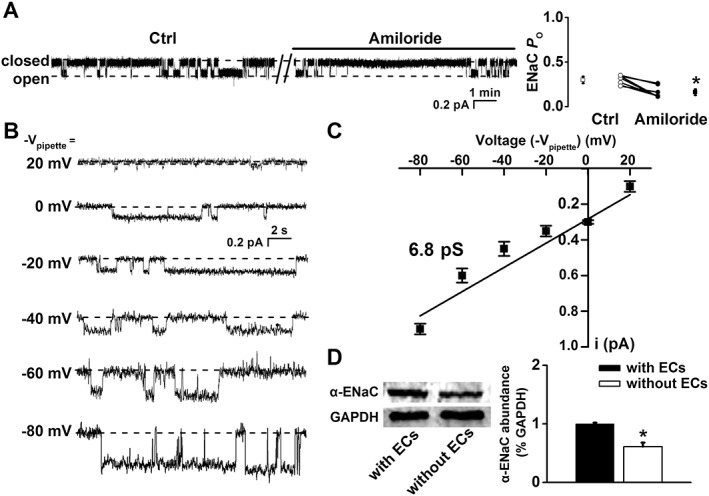
Mouse thoracic aorta expresses functional ENaC. (A) Representative ENaC single‐channel currents recorded in endothelial cells attached to split‐open aorta, before and after application of 0.5 μM amiloride (left). Summarized P O values obtained from the recordings are shown on the right (*P < 0.05; n = 7). (B) Single‐channel currents recorded at the indicated voltages. (C) I–V relationship constructed using single‐channel current amplitude measured as a function of voltages applied to the patch pipette (Vpipette). Single‐channel conductance was determined via linear regression as indicated by the black dashed line (n = 8 for the data point at −Vpipette = 0 mV; n = 7 for the data points at −Vpipette = −20 and −40 mV; n = 6 for the data points at −Vpipette = 20, −60 and −80 mV). (D) Western blot of α‐ENaC from aortic tissue either with or without endothelial cells (ECs) attached (n = 5 for each group; *P < 0.05). Ctrl, control.
