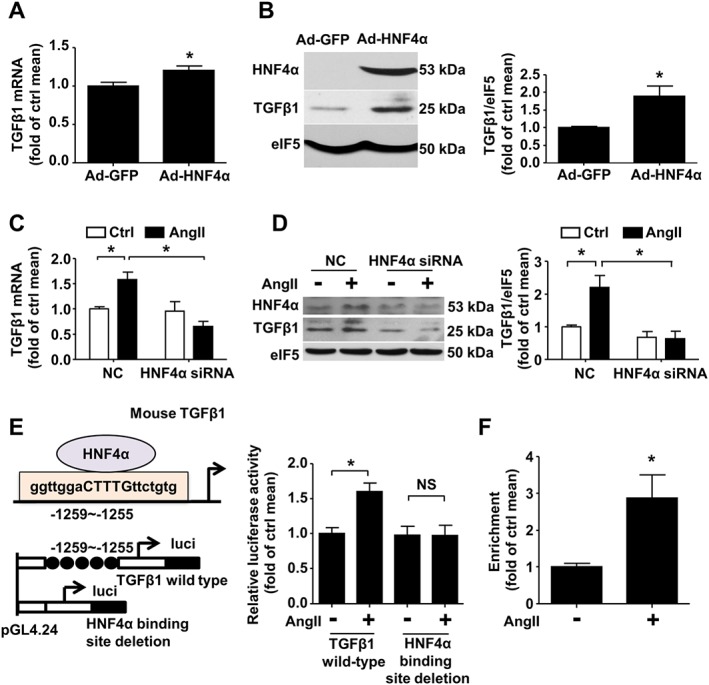
Figure 2.

AngII increases the HNF4α protein levels and HNF4α binding activity. (A) Quantitative real‐time PCR analysis of TGFβ1 mRNA expression in CFs treated with Ad‐GFP or Ad‐HNF4α at a multiplicity of infection (MOI) of 15. (B) Western blot analysis of TGFβ1 and HNF4α expression in CFs infected with Ad‐GFP or Ad‐HNF4α. (C) Real‐time PCR analysis of TGFβ1 mRNA expression and (D) western blot analysis of TGFβ1 protein expression in CFs transfected with negative control (NC) or HNF4α siRNA and then exposed to AngII for 24 h. (E) Left panel: Schematic of the interaction of HNF4α with the Tgfb1 promoter region and the structures of the reporter plasmids carrying the full Tgfb1 promoter region (wild type) or carrying the −1259/−1255 bp site deletion fragment (mutant). Right panel: MEFs were transfected with the wild type or mutant plasmid and then treated with AngII or untreated. A dual luciferase reporter assay was performed. (F) ChIP analysis using antibodies against HNF4α or IgG, soluble chromatin (~500 bp in length) from CFs treated with AngII, and primers targeting the region spanning the HNF4α binding sites in the Tgfb1 promoter, n = 6. For (A–E), data are expressed as means ± SEM from five independent experiments. *P < 0.05, NS = not significant. Student's unpaired two‐tailed t‐test (A) or Welch's t‐test (B and F) was used. Two‐way ANOVA with the Bonferroni post hoc test was used in (C, D and E).
