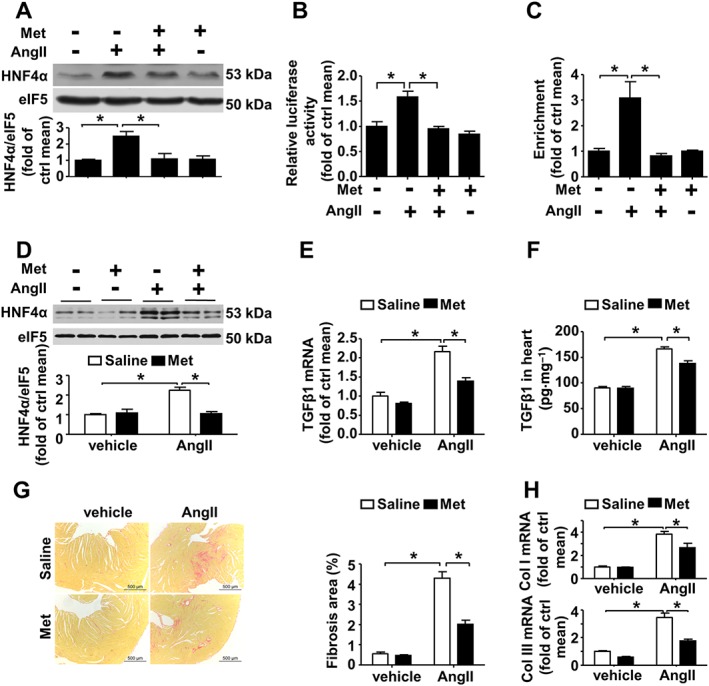
Figure 4.

Metformin inhibits AngII‐induced HNF4α and TGFβ1 expression. (A) Western blot analysis of HNF4α expression in CFs. Met: metformin, n = 6. (B) MEFs were transfected with the reporter plasmid carrying the full Tgfb1 promoter region and then treated with AngII or metformin. A dual luciferase reporter assay was performed, n = 6. (C) ChIP analysis using antibodies against HNF4α or IgG, soluble chromatin (~500 bp in length) from CFs treated with AngII and/or metformin, and primers targeting the region spanning the HNF4α binding sites in the Tgfb1 promoter, n = 5. (D) Western blot analysis of HNF4α expression in wild type mice treated with AngII and/or metformin. (E) Quantitative real‐time PCR analysis of TGFβ1 mRNA expression in heart tissue lysates. (F) The TGFβ1 protein level in the heart as determined via elisa. (G) Left panel: representative micrographs of Sirius red‐stained heart sections; the red areas represent collagen. Bars = 500 μm. Right panel: the fibrotic area was quantified as the percentage of the total cardiac area. (H) Collagen I (upper panel) and collagen III (lower panel) mRNA expression was measured via real‐time PCR analysis. Data are presented as means ± SEM of eight mice per group. *P < 0.05. Welch's ANOVA with post hoc Games–Howell test was used (C, G and H). Two‐way ANOVA with the Bonferroni post hoc test was used for the other panels.
