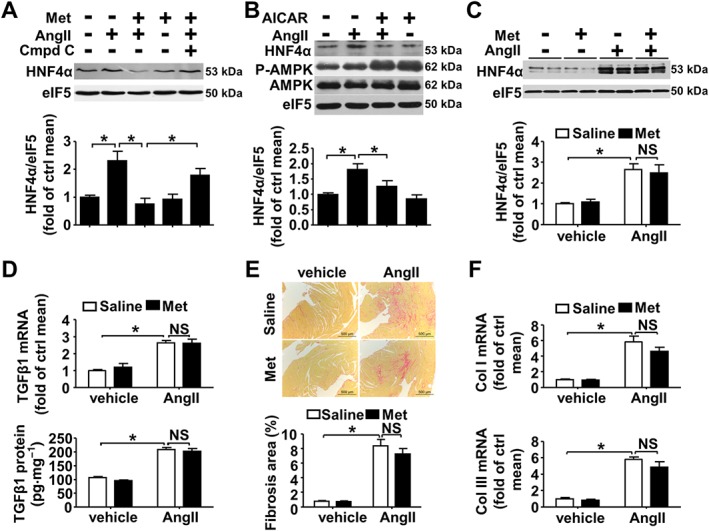
Figure 5.

Metformin inhibits AngII‐induced HNF4α expression, TGFβ1 expression and cardiac fibrosis in an AMPK‐dependent manner. (A–B) Western blot analysis of HNF4α expression in CFs. (A) CFs were pretreated with Compound C (1 μM) for 0.5 h and then treated with metformin (1 mM) for 2 h. Afterwards, AngII (1 μM) was added for 24 h before harvesting. n = 5. Met: metformin; Cmpd C: Compound C. (B) CFs were pretreated with AICAR (0.1 mM) for 1 h and then treated with AngII (1 μM) for 24 h before harvesting, n = 6. (C) Western blot analysis of HNF4α expression in AMPKα2−/− mice treated with AngII and/or metformin. (D) Upper panel: quantitative real‐time PCR analysis of TGFβ1 mRNA expression. Lower panel: the TGFβ1 protein level was determined via elisa. (E) Upper panel: representative micrographs of Sirius red‐stained heart sections; the red areas represent collagen. Bars = 500 μm. Lower panel: the fibrotic area was quantified as the percentage of the total cardiac area. (F) Collagen I (upper panel) and collagen III (lower panel) mRNA expression was measured via real‐time PCR analysis. Bars represent means ± SEM of eight mice per group. *P < 0.05, NS = not significant. One‐way (A) or two‐way ANOVA with the Bonferroni post hoc test was used (B and D). Welch's ANOVA with post hoc Games–Howell test was used in (C, E and F).
