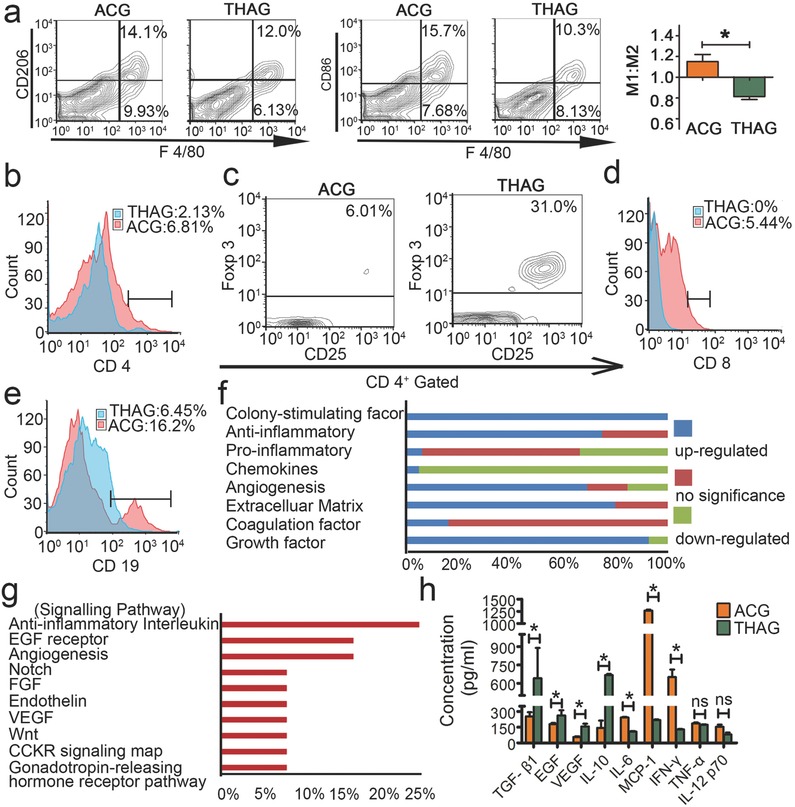
Figure 3.

Formation of immunosuppressive environment in THAG. a) (left) Representative FACS analysis of CD206/F4/80 and CD86/F4/80 and (right) M1/M2 proportion (calculated by the number of CD86+/F4/80+ cells divided by that of CD206+/F4/80+ cells) of the cells in neo‐tissue at Day 9 after first injection of THAG or ACG; b–e). Representative FACS analysis of b. CD4+ T; c. CD25+Foxp3+ Treg (CD4+ gated); d. CD8+ T and e. CD19+ B cells in neo‐tissue as described above; f) Hierarchical cluster analysis of 78 kinds of soluble proteins in the supernatant of neo‐tissue homogenate in the animals treated with THAG relative to that with ACG according to molecular function; g) Pathways enriched by the up‐regulated proteins shown in the panel f with Gene Ontology Pathway analysis. h) The levels of growth factors (TGF‐β1, EGF and VEGF) and inflammatory cytokines (IL‐10, IL‐6, MCP‐1, IFN‐γ, TNF‐α and IL‐12p70) in neo‐tissue as in panel a. Results are shown as mean ± SD (n = 8–10 mice per group; *P < 0.05 versus ACG; ns = not significant).
