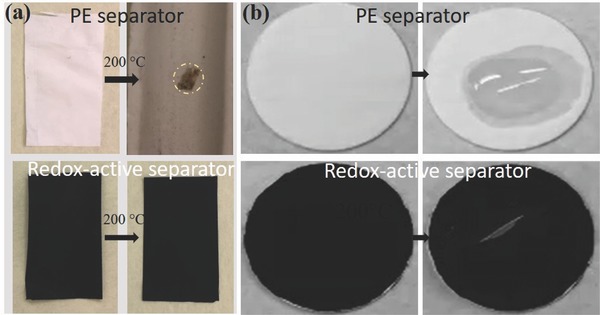
Figure 4.

a) Thermal stability of the PE (upper photos) and redox‐active (lower photos) separators at elevated temperatures (the left and right photos were taken before and after heat treatment, respectively). b) Electrolyte wettability test of the PE and redox‐active separators (the left and right photos were taken before and after the addition of the electrolyte, respectively). The electrolyte spreading processes can be further compared in Video S1 in the Supporting Information.
