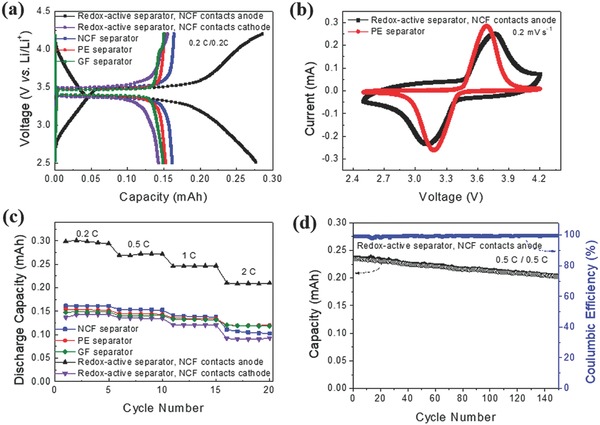
Figure 5.

Battery performance for cells comprising LiFePO4 cathodes, Li anodes, and different separators. a) Charge/discharge profiles obtained at a rate of 0.2 C. b) Cyclic voltammograms recorded at a scan rate of 0.2 mV s−1. c) Discharge capacity as a function of the cycling rate. d) Capacity and Coulombic efficiency as a function of the cycle number for Cell I. The thicknesses of the redox‐active, NCF, PE, and GF separators were 10, 10, 25, and 255 µm, respectively.
